Modern IT infrastructures are more complex and more dynamic than ever before. Hardware changes constantly, virtual environments are created and destroyed, and applications can span multiple data centers. In order to ensure the health and stability of these environments, we first need to gain complete visibility into how they operate.
Infrastructure monitoring is the process of collecting data about your IT infrastructure in order to make operational decisions. It uses data generated by applications, servers, network devices, and other components to track metrics such as hardware capacity, network throughput, and uptime. The resulting insights allow IT teams to increase efficiency, identify and resolve problems, and highlight areas for improvement.
Why is infrastructure monitoring so important?
Infrastructure monitoring is a vital part of infrastructure management, which involves managing the equipment, policies, processes, and other resources that affect an organization’s IT foundation. Two primary management goals are minimizing downtime and increasing efficiency. To accomplish this, IT teams need to collect and analyze data from each component. This data is provided through monitoring.
For providers like Google, Site Reliability Engineering (SRE) is an entire discipline dedicated to the smooth, reliable, and efficient performance of IT environments. Site Reliability Engineers ensure customers can access applications and services with as few interruptions and as little latency as possible. This principle is reflected in Service Level Agreements (SLAs), which promise specific levels of performance to customers. Essentially, they are contracts specifying the performance metrics—called Service Level Objectives (SLOs)—that the service will provide for the customer such as uptime, responsiveness, and capacity.
Ultimately, infrastructure monitoring helps organizations keep an eye on the state of their infrastructure and provide a better overall experience for their customers.
Which components should I monitor?
Almost any component in your infrastructure can be monitored. Listed below are some of the more important and most frequently monitored components.
Hosts
Host monitoring involves data surrounding an individual machine such as CPU, memory, and disk. Host monitoring is important for tracking the resources available for running your applications and services.
Web servers
Web server performance has a direct impact on customer engagement. Every millisecond counts when delivering websites to customers, and unexpected downtime can have catastrophic, long-term effects on the business.
Application servers and services
Application servers provide in-depth views into how your applications are running. For example, monitoring a Java application running in the Java Virtual Machine (JVM) can help you detect threading issues, memory leaks, and even garbage collection issues.
Databases
Unoptimized database calls can cause high amounts of latency, especially as the size of your database grows. Monitoring your databases lets you gather statistics on large or failed queries, active connections, and cache hits.
Containers
Container runtimes track detailed information about container performance including resource usage, runtime, which hosts your containers are deployed to, and events. This tells you how well your container deployment strategy is working, and which containers need more attention.
Networks
As with web servers, slow network performance can quickly lead to upset customers. Customers who can’t use your product will quickly leave for competitors. Network monitoring involves constantly checking for traffic congestion, routing issues, and outages.
Load balancers
Web applications with large user bases use load balancers distribute traffic across multiple hosts. Load balancers help ensure the best performance and availability, even if a host goes offline. Monitoring load balancers is essential to maintaining this process and making sure your application is always reachable, even under heavy load.
Cloud platforms
Cloud platforms such as AWS, Google Cloud, and Azure can greatly accelerate your deployment strategy, but they also introduce complexities in managing your infrastructure. Monitoring cloud platforms lets you continue tracking performance and availability despite not owning the underlying hardware.
Types of monitoring data?
Four types of data are especially important to a good monitoring strategy: logs, metrics, traces, and user experience.
Logs are records of events that occurred at specific points in time. A log is an immutable record describing when something happened, where it happened, and why it happened. Logs store messages in plain text, allowing developers to customize them and IT staff to read them. When viewed in sequence, logs tell a complete story about the actions performed and the errors encountered by your applications and hosts.
Metrics are measurements taken of an asset, resource, or process at a point in time. Unlike logs, metrics are numeric values, making them easier to graph or perform computations on. For example, metrics collected on CPU usage will show you how the CPU usage of your hosts has changed over time.
Traces record specific transactions as they travel throughout the infrastructure. A transaction can be an incoming HTTP request from a user, a database call, a remote API call, etc. Traces are useful for understanding the effect that certain actions have on your applications and overall infrastructure.
User experience is a record of what real users experience when using your app or site. This is a critical component to understand the drivers of user satisfaction and retention. It includes page load time across different geographies, what devices and browsers they are using, etc. The latency from the user’s perspective can vary widely from the latency on your server. It gives you the insights needed to provision infrastructure that will deliver the expected performance.
The four golden signals
For operations engineers, it’s very important to monitor what is known as the “four golden signals“: latency, traffic, errors, and saturation. Respectively, these metrics track the time taken to service requests, the number of requests per second, the rate of errors when servicing requests, and the percentage of your total capacity that is being utilized. Google’s SREs define these metrics as the essential components in delivering a service with high availability. They should become a critical part of your SLOs and the focus of your monitoring efforts. Doing so will help you keep performance as a top priority and maintain customer satisfaction.
What should I look for in a monitoring solution?
Infrastructure monitoring solutions range from small, single-node applications to distributed, enterprise-grade solutions. When choosing a solution, consider the following factors:
Supported platforms
Does your monitoring solution support on-premise systems and hybrid or multi-cloud environments? Many monitoring solutions provide integrations with third-party platforms such as AWS, Azure, and Google Cloud. Other solutions will work, but the data provided may not be as granular. Also check whether the solution supports all the infrastructure resources you depend on, including load balancers, databases, and more.
Continuous collection vs. sampling
IT infrastructures generate enormous amounts of data. Collecting, processing, and storing all of this data can become expensive, especially for larger infrastructures. However, the less data you collect, the less granular your insights will be. Whether you continuously collect data or periodically sample data will depend on how granular you want your data to be.
Accepts all monitoring data
Legacy monitoring solutions are often built for only a single type of data. Infrastructure monitoring may be completely separate from Application Performance Monitoring (APM). This can make it more difficult to set up and troubleshoot problems that may cross several domains. It’s best to choose a solution that offers support for a broad set for all four types of monitoring data.
Cost
Price is always a key factor when choosing a solution. Enterprise-level solutions may offer the most features and support options, but they can also be prohibitively expensive causing organizations to pick and choose which services to monitor. A solution like SolarWinds® AppOpticsTM will let you affordably monitor your entire infrastructure without losing observability.
Using monitoring solutions
The overwhelming amount of data presented by monitoring solutions can be difficult to navigate at first. However, once you know what to look for, you can quickly start using this data to generate insights.
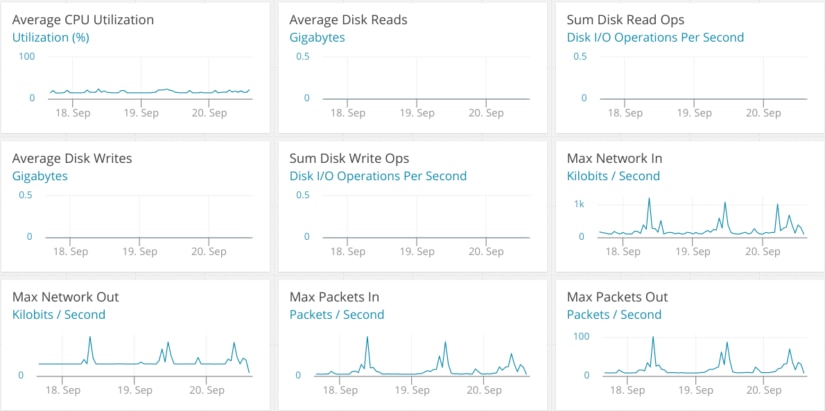
Using dashboards effectively
Dashboards provide at-a-glance views at the state of your infrastructure at any given moment. As such, they should contain the most pertinent and the most critical information: uptime, network latency, resource consumption, errors, etc. Dashboards are often reconfigurable and consist of widgets such as charts, numbers, and summaries.
Using alerts
Alerts are an effective tool for quickly notifying IT staff of unusual behaviors in your infrastructure. Since most infrastructure monitoring solutions analyze data in near real-time, this allows for instant notifications in case of a problem. You’ll want a solution that integrates with your team’s existing notification system, whether it’s through PagerDuty, Slack or another system.
The challenge is that it’s surprisingly easy to create alerts that fire too frequently, resulting in IT teams becoming desensitized to them. The most effective alerts are those that contain smarter trigger conditions using statistics beyond simple counts, and thus reduce the possibility of a false positive alert.
Correlating metrics and logs
Although measured differently, metrics and logs share a great deal of information. Metrics explain what your infrastructure is doing, while logs explain why. For example, imagine that users are suddenly getting disconnected from your service. The metrics show a sharp drop-off in the number of active connections to a specific host, but they alone don’t explain the problem. However, looking at the host’s logs shows that the application server is generating internal errors, causing users to get disconnected quickly.
Next steps
Infrastructure monitoring is a vast and detailed topic. This article explained the basics, but there is a lot more to cover if you want to become an infrastructure monitoring pro. In the future, we will be releasing a comprehensive guide that walks you through the process of monitoring each component in your infrastructure, from applications to cloud platforms. Stay tuned for more information!