Application Time-Series KPI Metrics
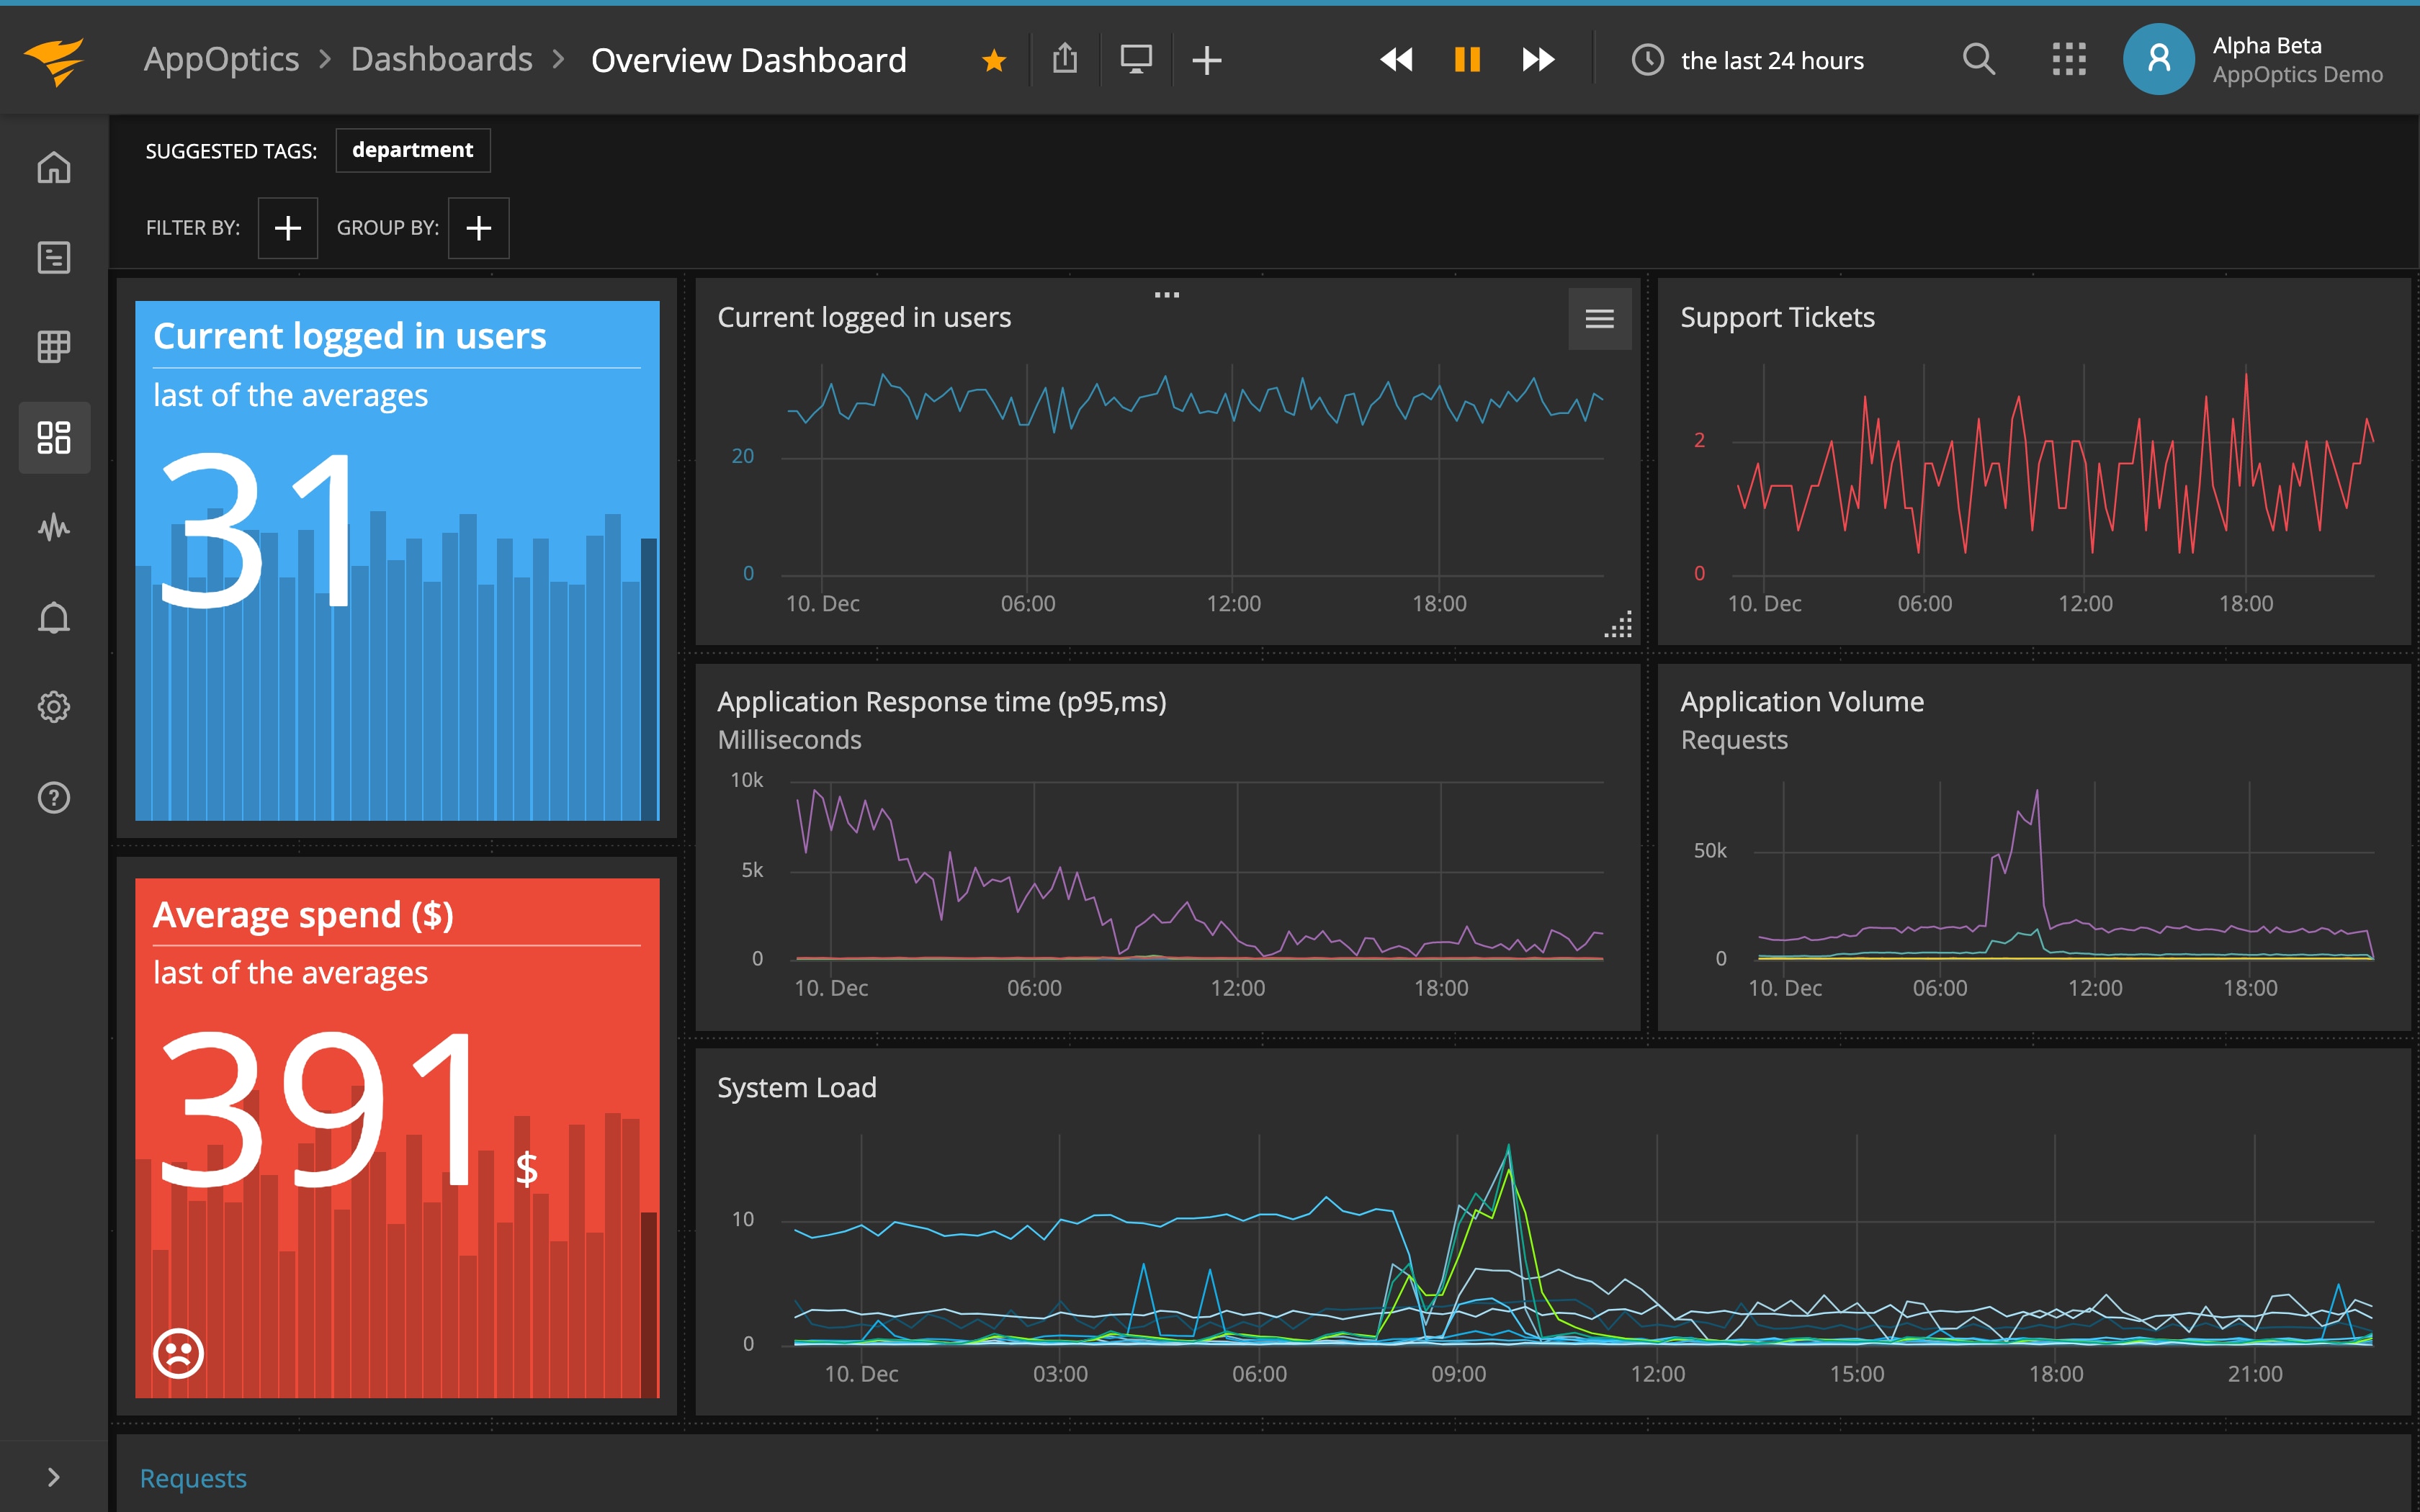
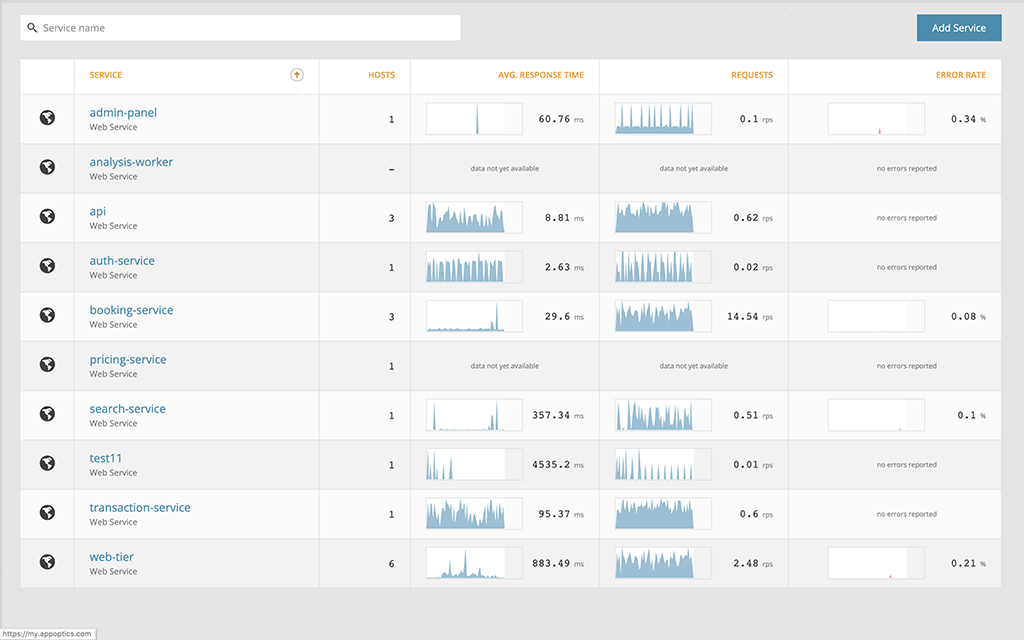
Application time-series metrics, as their name implies, are metrics captured over a period of time, for the purposes of detecting performance anomalies and forecasting. Time-series metrics are not typically used for diagnosing the root cause of performance problems, but rather for detecting performance problems. Examples of time-series metrics include:
- Requests Per Minute
- Average Response Time
- Error Rates
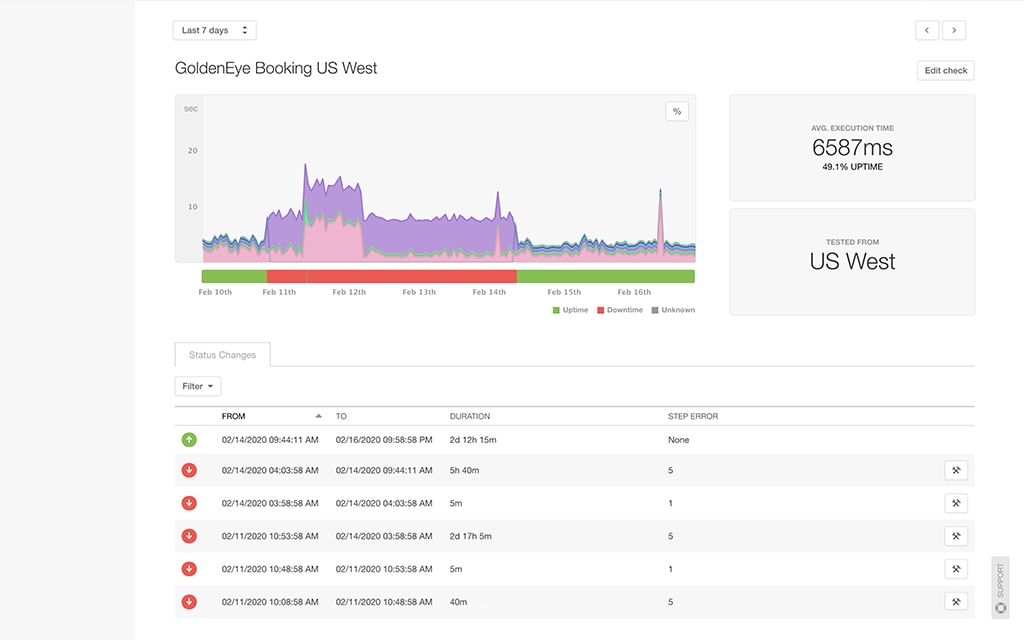
Time-series metrics allow you to view the performance of your application over time. This means that they can feed a rules engine so that it can raise alerts when things are behaving abnormally. For example, if you were to capture the average response time of key web service calls over a period of a couple days or even a few weeks, you would be able to compare the current response time of those web service calls to their historical response times and raise an alert if the current response time is, for example, more than two standard deviations from the historical mean. These metrics allow you to understand what is normal so that you can detect what is abnormal.
Furthermore, because time series metrics capture historic behavior, they can provide great insight into the future, meaning that they can be used to identify trends and drive your forecasts. You may choose to plot a simple linear regression line, or leverage a more sophisticated data science algorithm, to predict when you are going to need to purchase more hardware or scale up what you already have.
The granularity of data allows you to examine current service requests against a historic average or even by looking at the performance of this application based on the hour of the day. Longer time-series data would enable you to look at response times against things like the day of week or day of the month.
Additionally, time-series metrics are captured and aggregated at various granularities, including:
- Service-level
- Application-level
- Transaction-level
- External dependency
Modern enterprise and web applications are not constructed as large stand-alone monoliths, but are composed of many loosely coupled components, most typically services. It is important to be able to view the performance of your services individually, such as authentication and authorization services, that are used across applications in your ecosystem. Performance degradation of an individual service may have cascading effects across multiple applications, so viewing the performance of services individually is important.
Although modern applications are composed of loosely coupled services, they still ultimately contribute to the behavior and performance of specific business applications. As such, your APM tool needs to be able to aggregate service response times, that are part of an application, to that application. This provides you and your application business owners with the level of granularity necessary for tracking and ensuring the performance of business applications.
Applications are composed of a collection of different transactions. For example, a user may be able to log in to an application, add items to a shopping cart, and then check out. Each of these application flows represents different application transactions. While it is important to be able to understand an application’s holistic performance, it is also important to understand the performance of its constituent transactions. As such, your APM tool needs to be able to aggregate performance metrics at a transaction-specific level.
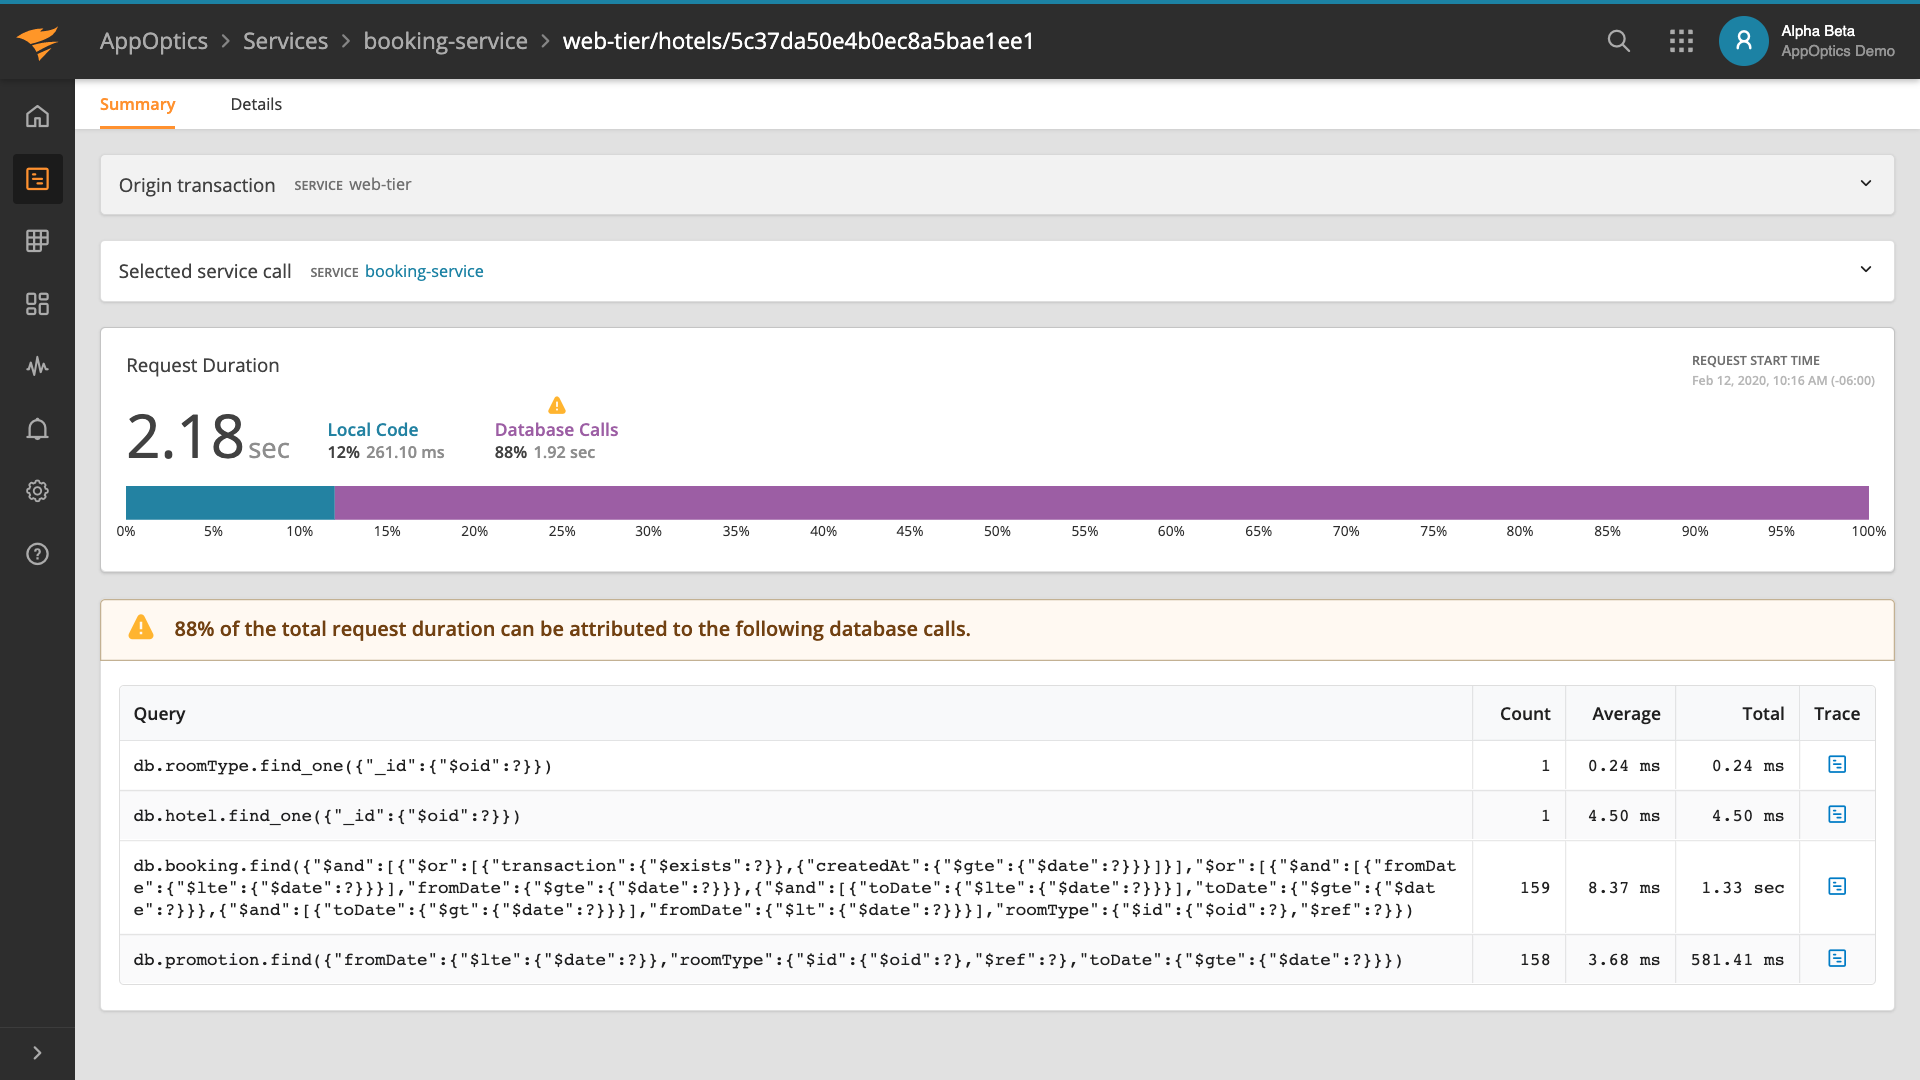
Finally, applications typically interact with external dependencies by making outbound calls to systems like databases, messaging systems, caching servers, and external web services. These are systems that you typically build, but they do contribute to the performance of your applications and are important to track and to isolate from the rest of your applications. Your APM tool needs to be able to identify these external dependencies and aggregate performance metrics for calls to these external dependencies, because resolving issues in external dependencies is far different from resolving issues in your application itself.
Time-series metrics are at the heart of APM solutions. Without these metrics, an APM tool cannot do its job. Time-series metrics provide the data required for an APM tool to detect abnormalities, raise alerts, and capture traces for detailed analysis. Additionally, they provide the means to enable you to perform trend analysis and forecasting.
Infrastructure KPI Metrics
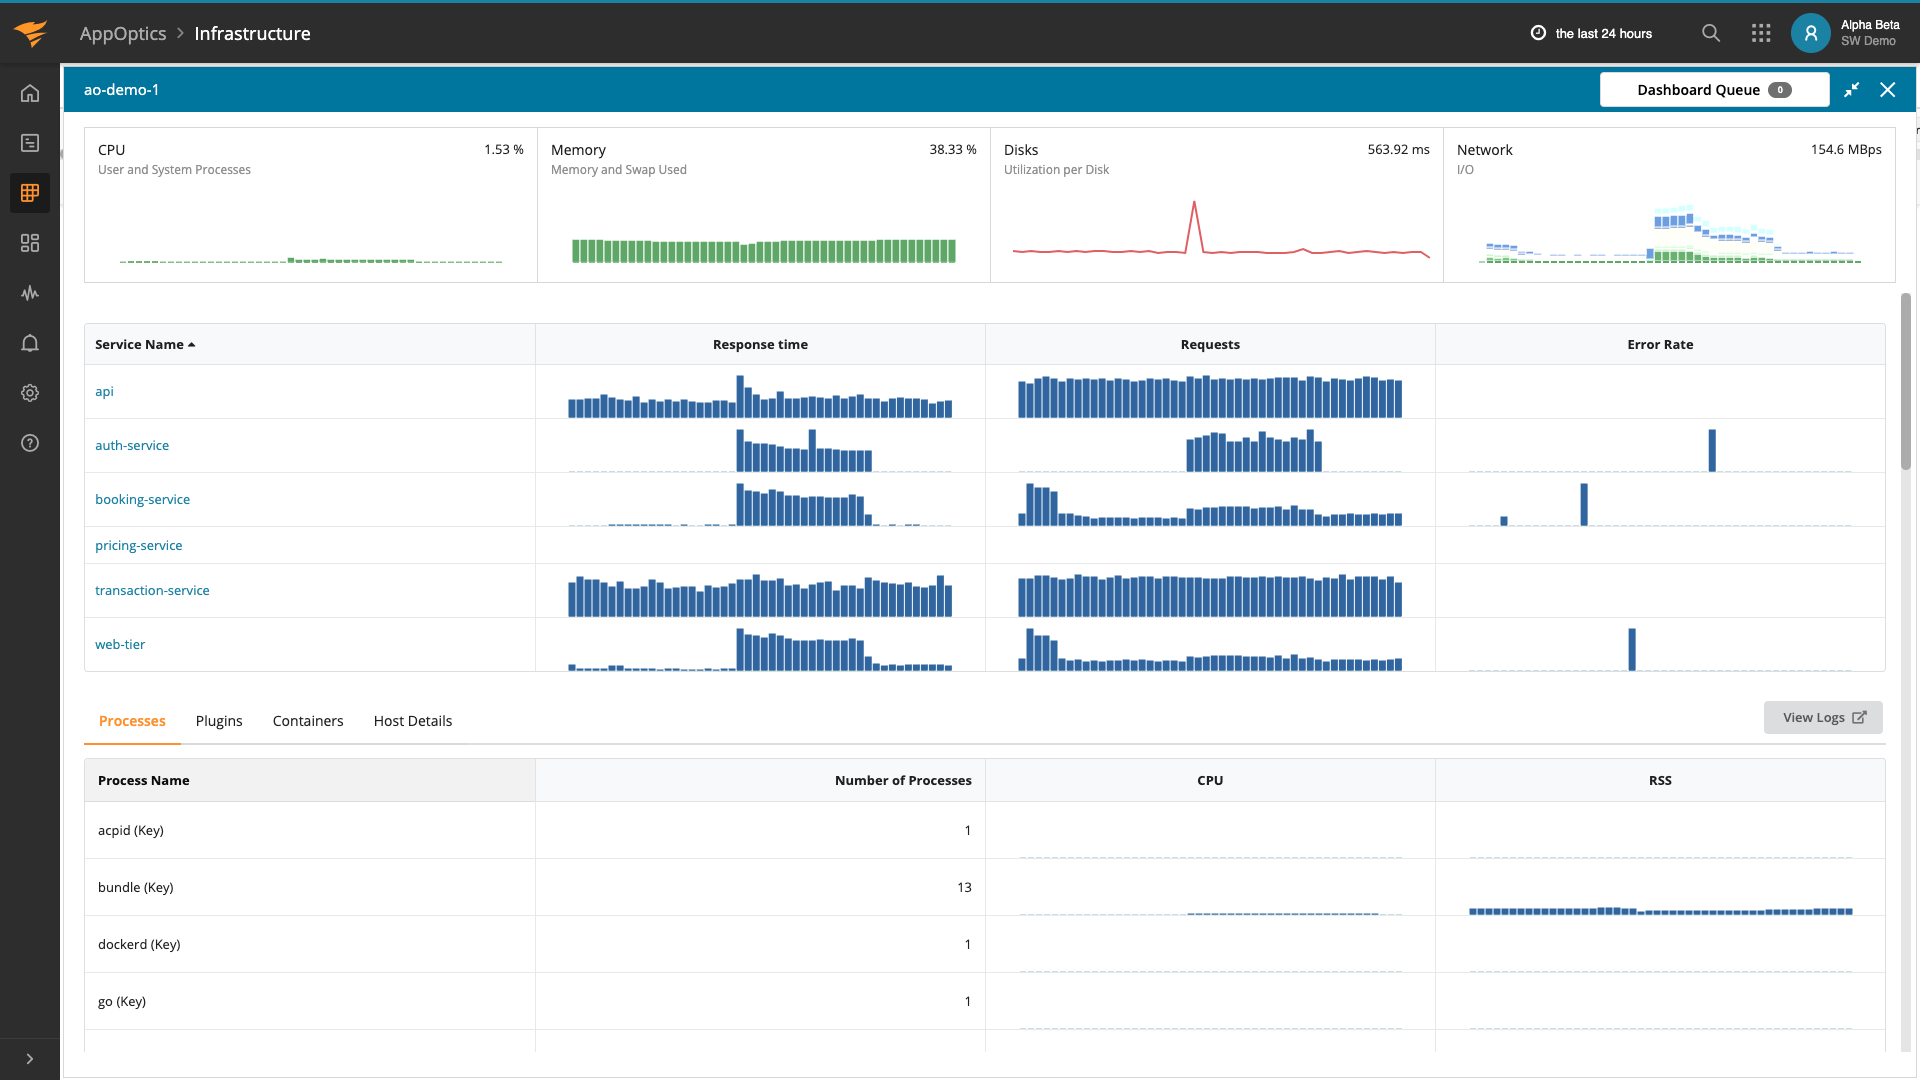
Regardless of the technology stack you chose to build your application on, it will ultimately run on infrastructure, whether that is a container/PaaS technology, virtualization technology, or directly on hardware. And the performance of your infrastructure can greatly affect the performance of your application.
In order to properly determine the performance of this infrastructure, you need visibility into the behavior of the physical machine, including things like CPU utilization, memory utilization, disk I/O, and network I/O. You also need visibility into the behavior of the virtual machine, including things like vCPU utilization, vMemory utilization, and so forth. If you are running in a container, you need visibility into its behavior. And finally, you need visibility into your application technology stack.
Your APM tool needs to be able to capture all of these metrics and then interpret them in a meaningful way. For example, 40% CPU utilization is actually not a good thing. You would rather see your physical machines running between 75% and 90% because below 75% means you are wasting resources, but above 90% and you are probably starting to run into thread and CPU contention. Your tool needs to be able to interpret these types of metrics as such.
