Over the past decade, organizations have been moving to a hybrid cloud model. A hybrid cloud is a form of cloud computing where applications are deployed on a combination of public clouds and private infrastructure. With a hybrid cloud, organizations can choose the most optimal deployment strategy for their applications while maintaining control over certain aspects, such as running user-facing services from a public cloud while storing sensitive data on-premise. In fact, 74% of enterprises leverage a hybrid cloud model, and this number is only expected to increase.
While hybrid clouds are useful, they’re not without challenges. Managing an application spanning multiple cloud platforms isn’t as straightforward as using a single platform—and monitoring is no different. In this article, we’ll explain the difficulties in monitoring hybrid cloud applications and how SolarWinds® AppOptics™ can help.
Why Monitoring a Hybrid IT Is a Challenge
The majority of large cloud platforms provide tools for collecting and consolidating diagnostic data from your workloads, including metrics, traces, and logs. For example, Amazon Web Services provides Amazon CloudWatch, Google Cloud Platform offers Google Stackdriver, and Microsoft Azure includes Azure Monitor.
When you start using multiple platforms, however, monitoring becomes much more difficult. You now have completely separate environments with separate tools to monitor each environment independently. In addition, each platform might present data in a slightly different way, provide different tools for querying data, or collect different kinds of data altogether. This duplicates the amount of effort engineers have to put into troubleshooting issues, configuring alerts, and comparing metrics.
Some monitoring services like Amazon CloudWatch can aggregate observability data from other sources, but this isn’t always a straightforward process. You’ll likely need to overcome blockages caused by virtual private clouds (VPCs), firewalls, role-based access controls (RBAC), and similarly restrictive measures. This is assuming your private cloud monitoring solution will even extend to on-premises infrastructure.
With these limitations in mind, how can we monitor our hybrid cloud environments in a uniform and centralized way?
How AppOptics Can Help
SolarWinds AppOptics is a comprehensive platform for monitoring application performance, infrastructure, and more. It aggregates metrics, traces, and logs from your applications regardless of the platform (data center, private cloud, public cloud) they’re running on. When using an APM to monitor hybrid environments, you can aggregate observability data from public and private workloads and access them from a single, easy-to-use web UI.

AppOptics makes it easy to view individual workloads and your entire application holistically. You may have workloads running in different environments, but you still provide a comprehensive service to your customers, and your monitoring solution should support this. With AppOptics, you have access to contextual data and traces measuring the overall performance of your application and each component. This makes it easy to drill down into individual components when troubleshooting poor performance or debugging an error.
Let’s say you have a customer-facing application deployed across multiple Amazon Elastic Compute Cloud (EC2 instances). All your data is stored on an Elasticsearch cluster running on-premises on bare metal servers, and your Elasticsearch is connected to EC2 using an AWS site-to-site VPN. Once data reaches 90 days old, it gets aggregated and stored in Azure Storage. This setup allows you to leverage EC2 for scaling, gives you complete control and ownership over your data, and avoids exposing Elasticsearch directly to the public internet.
Now, we want to implement a monitoring solution. We could use AWS CloudWatch or Azure Monitor, both of which support monitoring on-premises hosts but not the other cloud platform. We might also run into problems with networking due to the VPN or VPCs we have set up.
However, we can use AppOptics to monitor our AWS, Azure, and on-premises resources simultaneously. We can enable AWS CloudWatch and Azure Monitor integration in our AppOptics account, install the Azure agent onto our on-premises Elasticsearch cluster, and enable Elasticsearch integration to start collecting relevant metrics across our entire deployment. We can then access observability and performance data for our workloads directly from our AppOptics account.
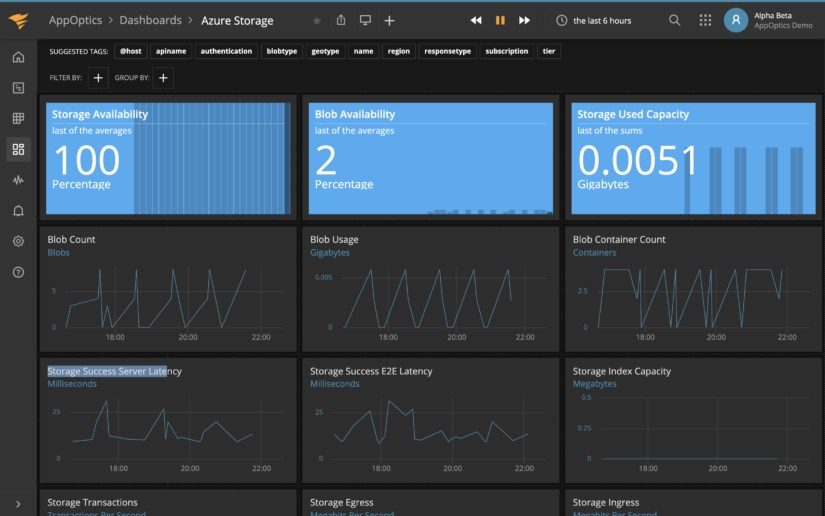
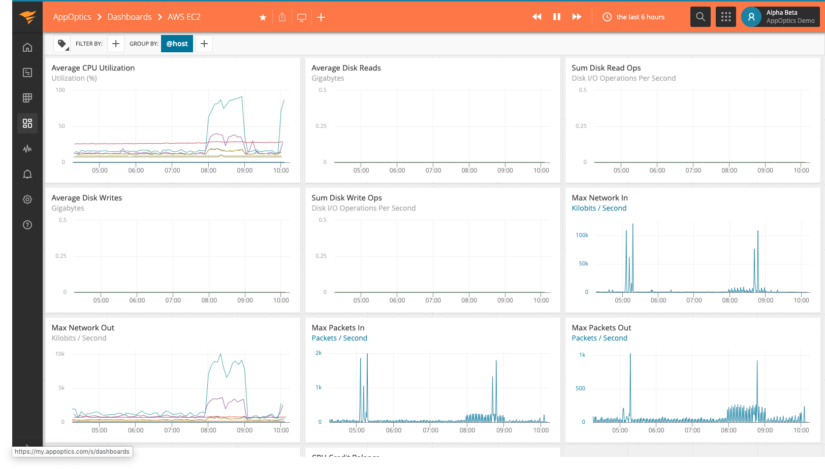
You can also select one of our curated dashboards for AWS or Azure to quickly view relevant metrics, such as EC2 performance:
Conclusion
The future of cloud computing is in hybrid and multi-cloud deployments. However, as applications become more distributed and leverage multiple platforms, the need for centralized APM will become more important.
If you haven’t experienced the simple-to-install and easy-to-use AppOptics, maybe now is the time. With AppOptics, you can easily monitor your applications and infrastructure regardless of the platform they’re running on. To get started, sign up for a free 30-day trial.