Back pressure is a signal that a service is at capacity and cannot accept more load. You’ve probably experienced back pressure without even knowing it. If you’ve ever seen a message like “the service is busy now, please try again later,” that’s essentially back pressure. It tells the requester what happened and gives them an opportunity to handle it, such as by trying again later.
Website operators have to constantly balance the capacity of their systems with efficiency. If they provision too little capacity, users may experience outages or delayed performance during peak demand. On the other hand, if they provision too much, they are underutilizing their resources and wasting money. Some infrastructure can scale elastically to meet demand, but it takes time to warm up.
How can we better manage back pressure and respond gracefully when it happens? We will run through an example of pushing WordPress to its limit to see what breaks first. We’ll also show you tools to monitor and find the root cause of back pressure in multi-tier applications.
The Back-Pressure Tradeoff
Like many things in life, back pressure can be seen as a good or bad response depending on the context. Back pressure is bad when the client is not designed to handle it. When the client cannot load or save data due to failed requests, we experience degraded performance or data loss. When we put pressure back on the user by showing an error message, it can be frustrating to them and they may lose trust in your service and bounce to someone else’s service.
However, computers can use this signal to take corrective action. They can save data locally to prevent data loss and try again. A load balancer can use this signal to either reroute the request to a server that is healthy, or a cache could return the last available copy as a fallback.
To deal with back pressure, systems often save data in queues or caches. These store data until the server is available again. These caches can be implemented on either the client or server side. For example, on the client side, this is similar to how Google Docs saves your document locally, and sends it to a server when your connection is back online. On the server side, NGINX can queue requests until an upstream server responds.
This boils down to a tradeoff between response time and availability. A service could be 100% available by simply storing all the requests in a queue and responding when it has a chance. However, the clients could end up waiting a very long time. We can return a response sooner by setting a limit or timeout. The right choice depends on your use case.
Monitoring Back Pressure
It’s important for system operators to monitor back pressure signals because they indicate a system is nearing its capacity limit. Leading indicators like response times and queue sizes are especially important because they give you time to respond proactively before the system becomes unavailable.
SolarWinds® AppOptics™ provides a convenient way to monitor your system infrastructure. It has monitoring integrations for host metrics, web servers, databases, and even applications. When part of your infrastructure is being pushed to its limit, AppOptics can tell you which part and give you alerts to proactively fix the problem before customers are affected. Let’s run through an example of how AppOptics can help you monitor and troubleshoot issues with back pressure.
Pushing WordPress to its Limit
WordPress powers 30% of websites worldwide, so it’s important to understand how it handles high loads. We’ll push it to the limit to see where it breaks, and how it responds when that happens.
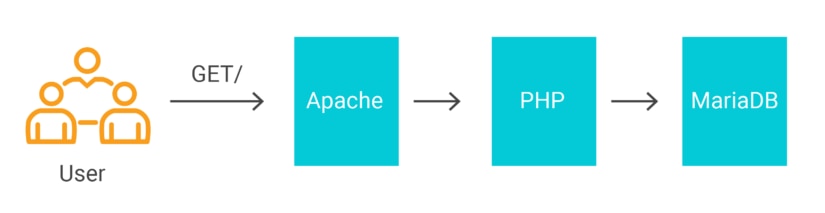
WordPress is built on the LAMP stack, which stands for the Linux, Apache, MySQL (or MariaDB), and PHP. When a user makes a request to a WordPress website, it flows through each of these layers in the stack as it is processed. Any of these layers may reach capacity limits before the others, putting pressure downstream.
For this example, we will use Helm to install WordPress and MariaDB in Kubernetes. Helm automates the installation so we can have it running typically in just a few minutes. We’ll use the standard configuration, but assign MariaDB a port on a host network interface so our monitoring system can access it.
$ helm install --name mariadb -f mariadb_values.yaml stable/mariadb$ helm install --name wordpress -f wordpress_values.yaml stable/wordpressAlso, we will enable the status module in Apache. This configures a status page for AppOptics to scrape server metrics.
$ kubectl exec -it wordpress-wordpress-77457c4c9b-fdmvn /bin/bash
$ apt update; apt install vim
$ vim /bitnami/apache/conf/httpd.conf
Add the following line to configure the location where the status page will be hosted.
<Location "/server-status">
  SetHandler server-status
</Location>
We need to set an exception to the rewrite rules that WordPress configures, so that the status page is served by Apache instead of WordPress.
$ vim vhosts/wordpress-vhost.conf
RewriteCond %{REQUEST_URI} !=/server-status
Next, configure the AppOptics integrations by following the documentation for Apache and MySQL monitoring. AppOptics uses the Snap open telemetry framework to capture metrics, and the configuration only requires one line change to the example file.
Now for the fun part! We will use Apache Bench to stress-test WordPress. This is a command line tool that can be run on Linux. We’ll ask it to generate a big spike in traffic by simulating connections from 500 users at the same time.
$ ab -l -r -n 500 -c 500 -k -H "Accept-Encoding: gzip, deflate" http://wordpress.services.devspotlight.com/Concurrency Level: 500
Time taken for tests: 19.029 seconds
Complete requests: 500
Failed requests: 0
Non-2xx responses: 215
Keep-Alive requests: 500
Total transferred: 5370104 bytes
HTML transferred: 5233392 bytes
Requests per second: 26.28 [#/sec] (mean)
Time per request: 19029.435 [ms] (mean)
Time per request: 38.059 [ms] (mean, across all concurrent requests)
Transfer rate: 275.59 [Kbytes/sec] receivedIn the output above, we can see that WordPress processed these requests in about 19 seconds. However, there were 215 non-2XX responses, which are failed responses. These failures mean that we pushed WordPress over its limit.
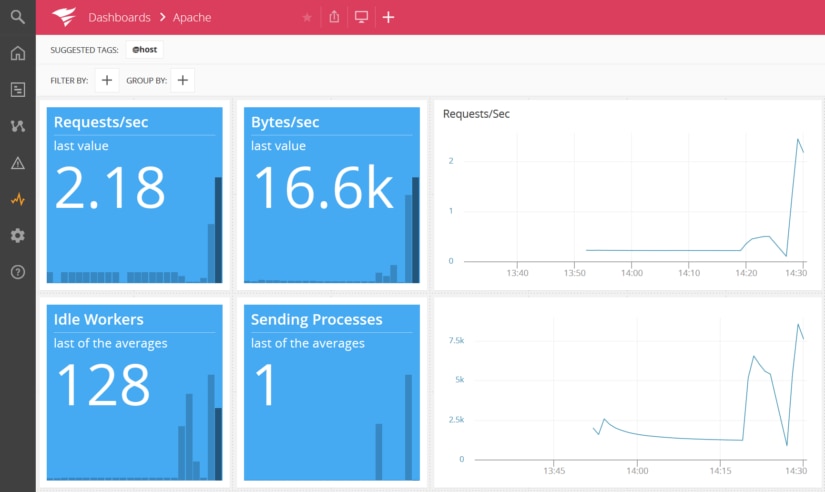
Below, we can see the Apache dashboard in AppOptics, including the big spike in requests per second. This dashboard is available out-of-the-box, giving you immediate insight into Apache traffic.
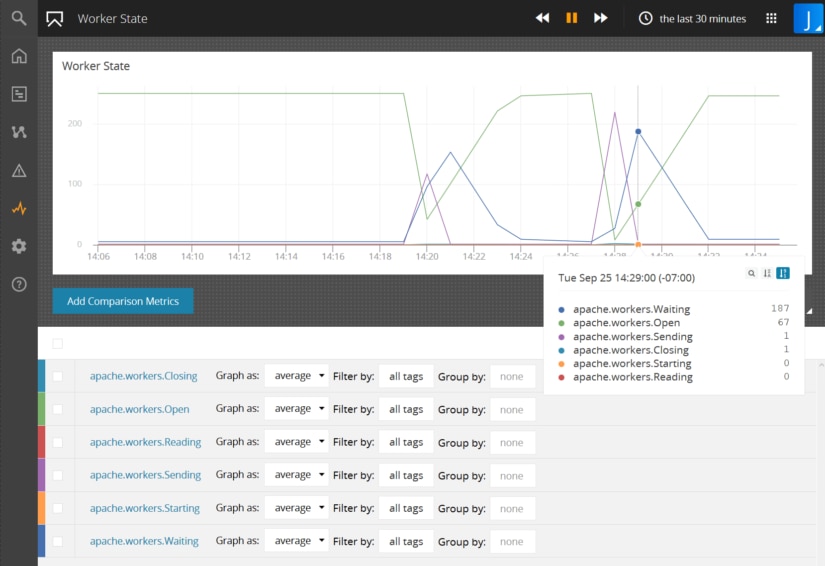
One important limit in Apache is the number of worker threads. To examine these more closely, we’ll plot the state of each worker in a custom chart. This shows that we have 250 workers that send and then wait for data before sending a response back to the client.
However, we still need more information to determine the cause of the HTTP errors. Let’s take a closer look to troubleshoot the cause of these problems.
Troubleshooting Back Pressure
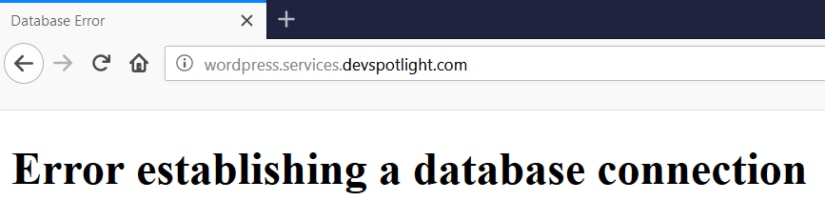
When we use our browser to open the webpage during the stress test, we get an error message saying, “Error establishing database connection.” This tells us that the capacity limit is not with Apache, but with the database.
Switching back to AppOptics to look at the MySQL dashboard, we can see that there are 149 connected clients, one for each Apache worker thread.
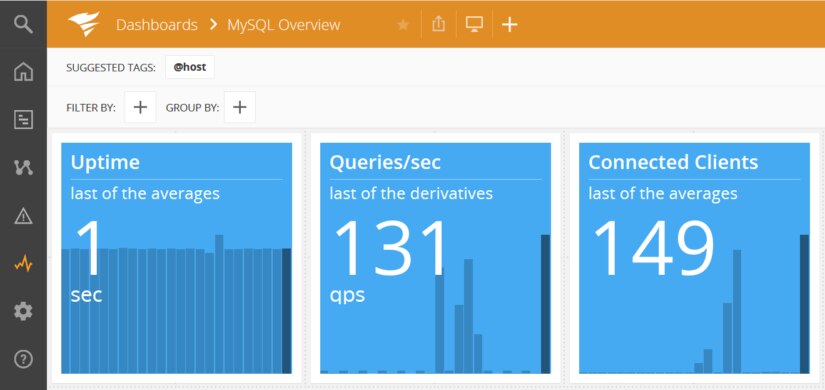
When we examine the max_connections variable in MariaDB, we see that the default value is 151 connections.
MariaDB [wordpress]> show global variables like 'max_connections';
+-----------------+-------+
| Variable_name | Value |
+-----------------+-------+
| max_connections | 151 |
+-----------------+-------+
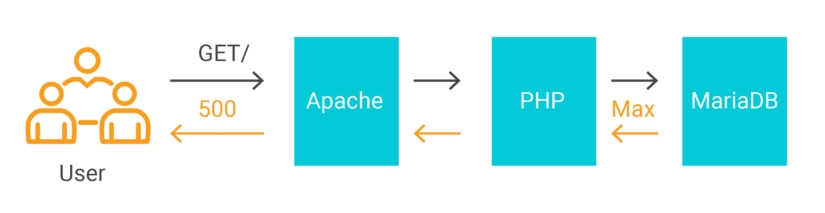
1 row in set (0.01 sec)Since Apache has 250 workers, it will try to make more connections than MariaDB allows. This creates an exception in PHP which causes Apache to return a 500 Server Error to the user. The database is over capacity and creates back pressure to PHP, Apache, and the user.
Monitor Your Own Stack
AppOptics can monitor a wide variety of applications beyond WordPress, including NGINX, Python, Node.js, Go, Postgres, Cassandra, and many more. It’s important for you to monitor your own stack for the effects of back pressure. Leading indicators like idle workers and connection count can give you an early warning. Setting an alert on these metrics can give your team time to respond proactively and scale your infrastructure before users experience availability problems. Learn more about using AppOptics for infrastructure monitoring and sign up for a free trial today.
The SolarWinds trademarks, service marks, and logos are the exclusive property of SolarWinds Worldwide, LLC or its affiliates. All other trademarks are the property of their respective owners.