We’re happy to announce SolarWinds® AppOptics™ Dev Edition, a new, free version of AppOptics aimed at helping developers gain visibility into applications during the development cycle to ship code faster with less bugs.
Why Use an APM Tool in Development?
We’ve all struggled with difficult bugs during development, the type that you just can’t wrap your head around and swear shouldn’t be possible. In cases like these, it’s common to start logging to the console; maybe printing a variable, or the classic ‘made it here’ statement just to get some insight into where the code is failing (or doing something unexpected). Print statements are an effective way to debug an application, but things get tricky when you are working with a distributed system. If you’re working with a distributed system, and you’re not familiar with the other services, print statements are going to be difficult to implement, understand, and cleanup. And, as it turns out, there is a much better way to get the visibility you need. Use an application performance monitoring (APM) tool. Even better, use a free one designed just for you: AppOptics Dev Edition.
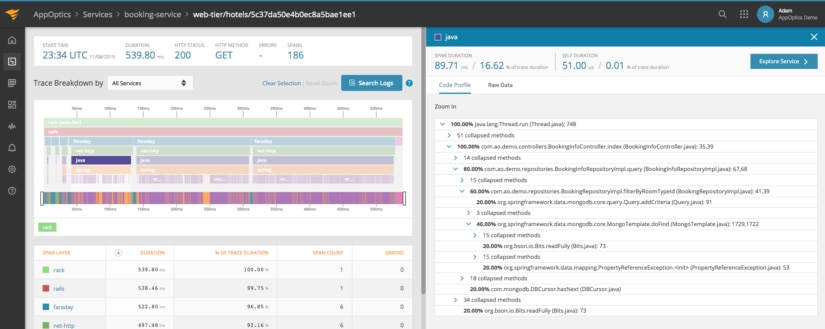
Automatic Distributed Tracing in Development
AppOptics Dev Edition has libraries for eight different languages, providing automatic distributed tracing. Distributed tracing works by instrumenting http client libraries, and automatically passing context to downstream services using a GUID in a header. If you want to stick with the tried and true method of using print statements during debugging, you can take advantage of the automatic distributed context by adding trace context to your log messages. The distributed context is only a small part of what the AppOptics Dev Edition libraries help with, they also instrument databases, caches, frameworks, and even offer profiling support to tune functions and methods. All of this information is visualized in a free, easy-to-use APM tool to give you the visibility you need at a glance.
Understand Resource Consumption Before Shipping to Prod
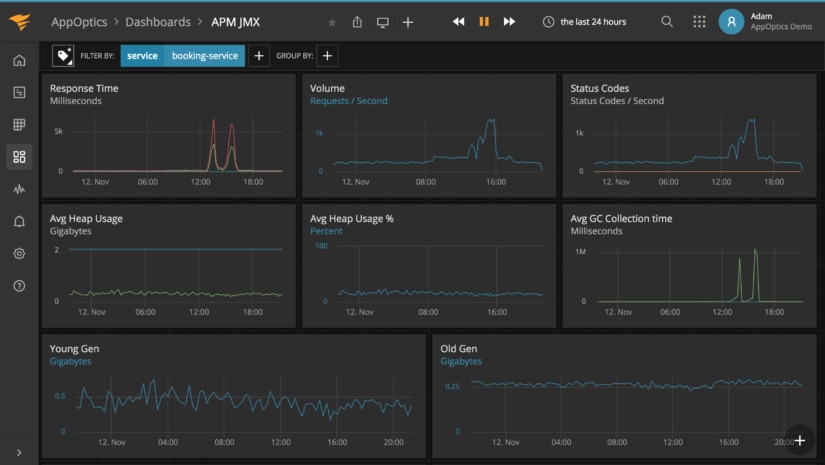
If your team is shipping a new service or a making a major change to an existing one, it’s important to know the effects this change will have on the underlying infrastructure in production. If your application is running on premise, chances are you have a finite set of CPU and memory, and you need to know if it will support the new changes. If your organization is more modern and is adding a new service to Kubernetes, it’s just as important to know the resource requirements since you should explicitly set them in the deployment manifest.
AppOptics Dev Edition provides insight into high level host stats such as CPU, memory consumption, disk I/O, as well as more detailed stats to help you tune a JVM such as garbage collection time, heap usage, thread count, and memory consumption by generation. Gain an understanding into how these restrictions will affect the application and ship your new services with the confidence knowing they will perform on the allocated resources in production.
Free Like Beer…What’s the Catch?
There isn’t one. The AppOptics Dev Edition is free like beer, not like a puppy. You don’t need to enter a credit card and you won’t suddenly be charged for anything. It’s designed for you to use in a development environment and allows the following:
- Maximum of three hosts and six containers
- 100 metrics (used for infrastructure monitoring or custom metrics through the API)
- Five traces per minute
In other words, it’s designed for you to use in your development environment.
How Do I Control the Five Traces Per Minute?
No need to worry; the APM agents use smart sampling and this part is handled for you. If you want to trace a specific request to debug an app that’s seeing traffic in staging, you can curl the application and set a specific header that will make sure it gets traced. The response will even include a trace ID you can use find the trace in the AppOptics Dev Edition UI. You can take advantage of this trigger trace functionality a few times per minute, often enough to trace a request after making code changes to see the effect.
Easy to Use, Easy to Get Started
AppOptics Dev Edition is a SaaS product, so there’s no need to host software on your own infrastructure. Simply sign up for a free dev account, add a library to your application, and avoid the frustration caused by debugging distributed applications using print statements.