
Monitoring your Java applications is an essential part of ensuring high availability and good performance. And yet, many Java developers hold off on practicing application performance management (APM) until they’ve already deployed their application to a test environment, or even to production. Perhaps they don’t have access to an APM solution with the right insights, or maybe they don’t have the time or resources to deploy to a temporary environment and wait for metrics to come in. Whatever the reason, developers who don’t use APM are missing out on data that can help make their applications more reliable.
That’s why we introduced SolarWinds® AppOptics™ Dev Edition, a free version of AppOptics designed to help you gain visibility into your Java applications without leaving your workstation. With AppOptics Dev Edition, you can test application performance, trace transaction calls across its components, and monitor containers, all before moving into production. In this post, we’ll explain how you can use AppOptics Dev Edition to improve your Java applications.
How Does APM Improve Java Development?
Using an APM solution in development may seem counterintuitive. After all, applications perform differently on production machines compared to developer machines, and development environments like Eclipse already provide extensive profiling and debugging data.
AppOptics Dev Edition provides several benefits over IDE tools, including:
Context and Traceability
AppOptics monitors Java applications and other applications, services, and infrastructure your application interacts with, including:
- Databases
- In-memory caches
- Web front ends
- Frameworks (such as Spring)
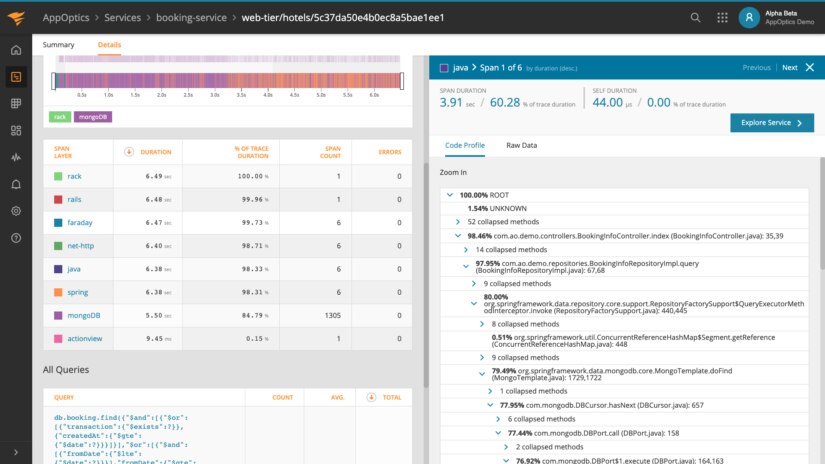
Not only can you view these alongside your application in AppOptics, but AppOptics automatically traces your application’s execution path through each component, so you can see exactly which component is under-performing. For example, the following screenshot shows a trace through an application with multiple different services, including a service using Java and Spring (selected).
Consolidation and Centralization
AppOptics stores metrics on our platform, so you have access to current and historical APM data for your applications in a single location.
Detailed Aggregate Metrics
AppOptics Dev Edition collects detailed JVM stats including:
- Garbage collection runs
- Heap usage
- Thread count
- Memory consumption
- High-level host metrics (such as CPU usage, RAM usage, and disk I/O)
This gives you a full view of application performance and resource consumption from the easy-to-use AppOptics web UI.
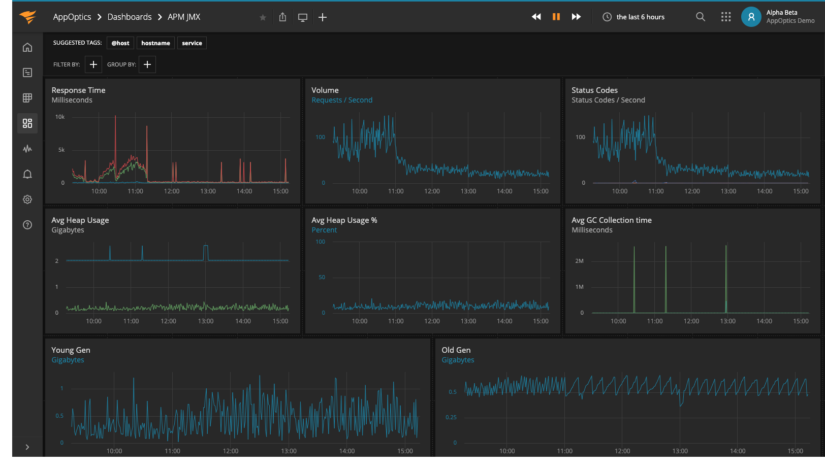
To demonstrate, let’s look at a JMX application we created to manage hotel bookings. We set up monitoring with AppOptics, ran the application for several hours, and simulated a large number of requests from around 12 to 4 p.m. This immediately caused corresponding spikes in response time (upwards of six seconds in some cases), the number of HTTP error response codes, and the time taken to run the garbage collector.
To find out what’s causing the errors, let’s look at one of the traces from that time range and sort by response time. The top response took over 35 seconds, so we’ll click on it to view the full request details. Right away, we can see our code only took 1.21 ms, and the calls to our MongoDB database took the remainder of the time.

Scrolling further down, we can see a list of queries and the amount of time each query took to run. In this case, the culprit is a query used to find a specific booking.
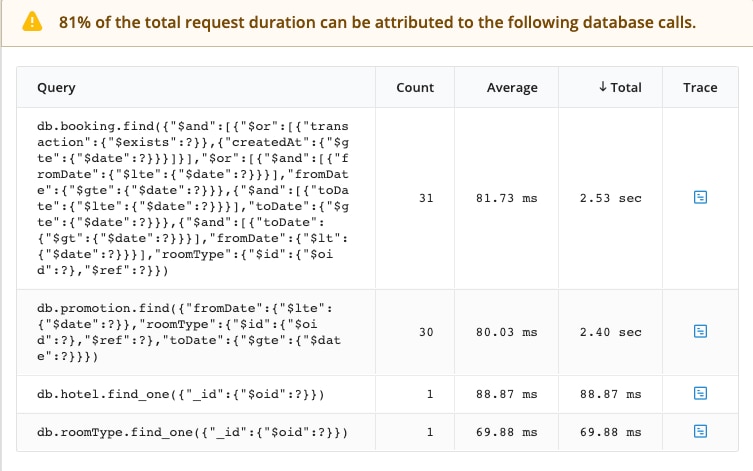
From here, we know our next step is to optimize our query (or MongoDB itself) to reduce the performance impact. By doing this in development instead of later in the SDLC, we can address the underlying problems early on and avoid delaying the release or causing a poor user experience. Best of all, we avoid causing any cascading failures or production outages.
Java is just one of several languages supported by AppOptics Dev Edition. You can also collect APM metrics for applications written in Go, Node.js, Python, and more. In addition to supporting the world’s most popular languages and frameworks, AppOptics Dev Edition excels at monitoring polyglot applications and microservices. Using AppOptics Dev Edition for your applications helps minimize bugs and verify performance before deploying to production, no matter the complexity of your applications.
How to Get Started With AppOptics Dev Edition
Getting started with AppOptics Dev Edition takes only a few minutes. Sign up for a free account and add the AppOptics Java agent to your project. Sign in to your AppOptics account at my.appoptics.com, start your application, and watch your application metrics, traces, and debugging data start appearing in real time.