Introduction
A well-functioning IT infrastructure and application fleet is one of the core elements to powering a successful modern business. But how can we ensure it’s indeed well-functioning?
Continuous monitoring is one of the methods to ensure an infrastructure setup is managed successfully. This can be split into two main components:
- Monitoring performance metrics
- Monitoring log events
A well-defined monitoring solution should provide a clear picture of the root cause when an outage occurs, or when its warning signs are first reported. This includes system(s) directly or indirectly impacted, metadata about the incident, relevant log messages leading up to the incident, and an automated alerting system to notify all relevant teams. Information should be easily accessible with both high-level visualizations (in the form of dashboards) and drill-down facilities.
Using the infrastructure management and monitoring platform, IT operations or other teams like DevOps should be able to pinpoint the root cause, restore the service within the SLA, and take proactive actions to avoid future outages. This in turn will result in lower IT management costs and improve customer experience.
In this article, we’ll talk about some best practices for setting up infrastructure monitoring with SolarWinds® products AppOptics™ and Loggly®.
Create a Strategy
The first step in a successful infrastructure management solution is to create a strategy. To develop such a strategy, IT teams need to communicate across departments and get feedback from business stakeholders. Soliciting this feedback will indicate which critical systems must be monitored and what the error conditions should be for alerting.
Consider this: does the business have enough resources to be proactive about avoiding incidents in the first place? Can they react quickly to an incident when it occurs?
The strategy needs to include:
- Scoped-in services: This is the list of infrastructure and peripheral systems the business deems critical for its operation. These would include such infrastructure as payroll systems, public-facing websites, file transfer systems, and so on. Although it may be tempting to cast a wide net and capture information about everything, not every system will have the same priority. For example, the build server or Git repo in a development environment may not be deemed as important as a web application firewall server.
- Scoped-in depth: Once the services and infrastructure are identified, the next step is to define the depth of information to capture. The line between infrastructure monitoring and application monitoring is sometimes blurred, especially when it comes to serverless (containers, functions) and managed services (database). This part of the strategy will dictate what information will be captured from each service component. For example, capturing the application logs from the containers running in a Kubernetes cluster may be more important than getting the cluster logs.
- Scoped-in stakeholders: The strategy should define which teams and stakeholders receive alerts and access to the monitoring solution. It will be part of an overall IT governance plan including, at a minimum, the parties responsible for each infrastructure component, the RACI matrix, escalation tree, triage method, etc. Having a clear delineation will avoid scope creep and unexpected demands.
- Scoped-in resources: It’s important to know what resources are available to respond to incident alarms. It’s logical to raise alarms only on critical incidents if human resources are limited. Also, it may be worthwhile to take a step back and think about designing scalable and self-healing architecture.
This strategy will dictate where the effort is spent in adding metrics (depth), dashboards (stakeholders), and alarms in the infrastructure monitoring solution. It also ensures everyone is aware of the trade-offs. This strategy can always be updated and reviewed at a later date if necessary.
At this point, it might be good to get yourself familiarized with the features of the management and monitoring solution used. This can be determining the number of integrations and plugins, coming up with a rough list of dashboards, or automating any agent installation to target systems.
Use a Phased Integration Model
Modern IT infrastructures are seldom simple setups. Most organizations will use one or more public cloud providers, and some will have a hybrid environment with on-premises legacy systems. This creates a complex environment to manage, so your monitoring system needs to be simple. This can be done by using one vendor that offers monitoring of all your scoped services and by selecting tools built to be easy to set up and use for your team.
The best way to bring the critical systems from this sprawl is to start small and simple. For example, the management and monitoring initiative may kick off with a pilot project including one of the following.
- A specific cloud-hosted environment for a particular department
- A particular application and all its components across on-premises and cloud environments
- All public-facing endpoints (web servers, load balancers, API gateways, etc.)
Depending on the lessons learned in the pilot project, the team can then further fine-tune the process to include:
- Migration of previous metrics, logs, thresholds, and alerts from multiple legacy monitoring systems to a centralized platform
- Repeatable and automated onboarding of existing and new services to the monitoring platform
- Standardized metrics, alerts, and dashboards
- New counters and metrics for interdependent systems
SolarWinds AppOptics offers over 150 plugins and integrations (commercial and community-supported) to interact with multiple OS, application, and cloud providers.
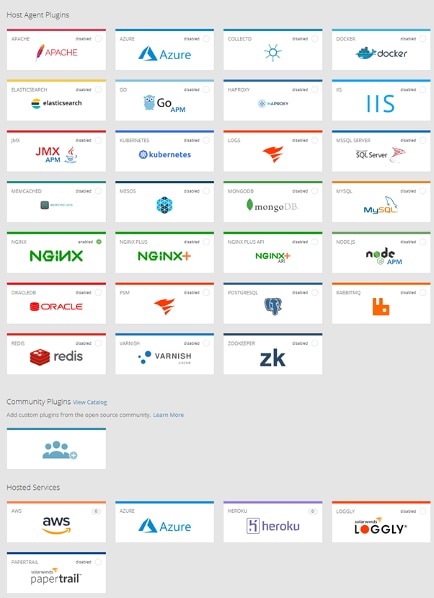
The starting point for any infrastructure monitoring would be setting up an AppOptics agent on a host. Once done, the agent will start recording and pushing the basic metrics to the AppOptics managed service. Here are a few points to consider:
- Use existing integrations when possible: There’s no need to write your own integration if one already exists
- Check the configuration file permission: The SolarWinds agent runs as a limited-privilege user and may not have read access to the configuration files created for the integration
- Secure status endpoints: Some integration requires the configuration of a status endpoint or local user (e.g., Apache, PostgreSQL)
Gather Relevant Metrics
With the strategy in place and agents installed, you can start evaluating the metrics needed for your infrastructure monitoring goals.
For example, let’s say you’re running a dynamic website on an AWS EC2 instance, and the business cares about the following:
- The latency and error rates of the application (related to customer happiness)
- The overall cost efficiency of the infrastructure (related to business profits)
The monitoring tools you probably want to add are:
- Nginx, Apache, or IIS integration to measure the HTTP request latencies
- The website access logs and error logs (for error rate)
- The AWS CloudWatch metrics for billing (cost)
- Performance metrics such as CPU, memory, or disk to right-size the instance and confirm efficient usage of resources
Modern distributed applications can consist of many different moving parts. Simply monitoring infrastructure, databases, and web servers may not always be enough. Of course, more metrics like database performance can always be collected and added, especially if they’re relevant to the business goals.
Consider other components such as message queues, enterprise service buses, container orchestrators, programming framework runtimes, or serverless functions. Metrics from each of these components should be considered for collection. However, secondary metrics should be differentiated from the primary metrics used for alerting—and shown when users “drill down” from the dashboards.
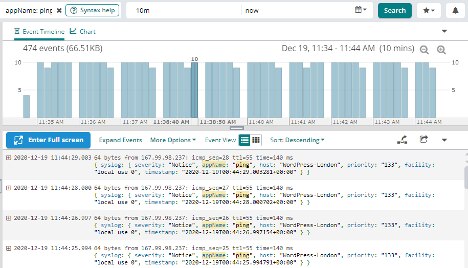
Integrate Logs Into the Picture
Logs are as valuable as metrics when it comes to troubleshooting system outages. The infrastructure management and monitoring strategy should include the type of logs needing to be collected and how long they should be kept. Some common log types are web server logs, database logs, cloud event logs, application logs, etc. Depending on how busy the system is or how verbose the logs are, only certain levels of information may need to be captured. For example, only log events with a level above “WARNING” or “ERROR” may prove useful.
Consider these challenges when integrating logs into a centralized system:
- Time zone-separate monitored systems may be in different geographical locations, using a different time zone, and the timestamps written in logged events may be missing this time-zone information. This would make logs correlation based on time value difficult.
- Gathering logs from heterogeneous sources may involve using different technologies. For example, syslog could be used for Linux-based logs but not for Windows events. Some systems may require using custom log collector agents. Managing different types of collection methods can be a cumbersome affair.
- Parsing log files from multiple sources and extracting events of interest to a common format can be a difficult process. Field formats and semantics aren’t always defined (e.g., should log level be a string, integer, what possible values should that field have?).
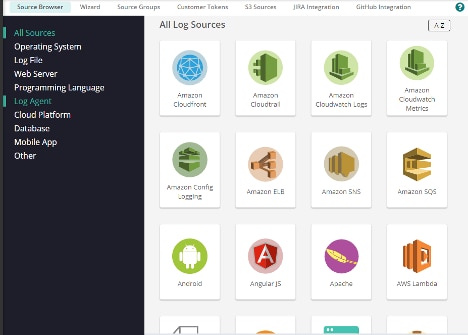
SolarWinds Loggly can help overcome these issues. It’s a powerful log collection and management solution offering:
- Agentless log collection from a multitude of log sources and storage in a centralized SaaS solution
- Automatic parsing and field extraction based on common log types
- Custom log parsing with RegEx
- Dynamic field explorer (DFE)—allowing you to drill down on log events
- The ability to create custom metrics from log events
- The ability to create dashboards from custom metrics
- Seamless integration with SolarWinds AppOptics
Additionally, as an infrastructure engineer, you want to ensure the following:
- Review tenancy of centralized logs: Unlike purely numeric metrics, log events can contain sensitive information such as names, email addresses, dates of births, phone numbers, SQL queries, etc. There may be data sovereignty issues when saving logs off-premises.
- Use the same time zone in all systems: Some log sources may not have time-zone information, which would default to the system time zone. You can use the same time zone (e.g., UTC) in all your applications. If this isn’t possible, ensure log events include the system time-zone information using an ISO 8601 format.
- Deploy NTP to ensure all systems are time-synchronized so logs can be correlated.
- Use JSON formatting: Where possible, use JSON-formatted logs, as it’s easier for log management solutions to parse these types of logs.
- Reuse field names: This improves filtering, alarming, and displaying logs in the centralized visualization system.
- Define and use a unique tracing field: Using a unique tracing field in all logs will help ensure the full correlation of an event across various systems.
- Use milliseconds precision in log timestamps: If a unique tracing field can’t be used (as is often the case), time ordering is the next best thing. With NTP synchronization—and milliseconds precision—this should provide some trusted ordering.
Save frequently used searches: This can save time and be used for creating dashboards or alarms. Examples can be invalid logins to the servers, network packets denied, or the number of successful database writes.
Create Targeted Dashboards
Having too many dashboards isn’t useful, especially if every user can create one. Before long, things spiral out of control and there are too many to choose from.
Instead, having a good standard and a set of guidelines on how to create and maintain dashboards—along with what important pieces of information to include—will help all stakeholders.
The dashboard may be technical (e.g., for DevOps, SecOps, SysOps), customer-centric (e.g., latencies and error rates), or business-centric (e.g., compliance-related).
AppOptics comes with many predefined dashboards you can customize for your infrastructure management:

Here are some best-practice tips for creating dashboards:
- Start with pre-built dashboards to get a good understanding of the monitoring integration enabled.
- Create custom dashboards for different target audiences. For example, there can be a business dashboard of unsuccessful sales transactions showing current user activities compared to similar values in past periods. There can be another dashboard for the operations and finance teams focusing on cloud-computing costs and resource usage. Another dashboard can be purely technical, with DevSecOps in mind.
Create Meaningful Alerts
Monitoring alerts are notifications triggered by an event when one or more metric values go beyond an acceptable threshold. For example, you can have an alert when a web server becomes unresponsive or a database server runs out of disk space. Usually, the alert is sent via an established communication channel to one or more teams who can then start investigating the root cause of the issue. The infrastructure management and monitoring strategy will have provided the main goals of the alerting implementation. But at a tactical level, more decisions need to be made:
- What systems should alert (production, development, ancillary systems) and under what conditions?
- Who should receive those alerts?
- If there’s already an existing alert triggering under similar conditions, what value does this alert add?
- What level of information will be included in the alerts?
- What’s the best channel for the target to receive those alerts?
The goal of those decisions is to minimize the number of false positives and avoid overloading the incident response team. Every alert must provide additional value to the incident and help in finding the outage’s root cause.
The usual alert channels include Slack, email, HipChat, Microsoft Teams, etc. AppOptics comes with more than ten notification integrations, including flexible ones like AWS SNS which can then be extended to whatever application endpoint you might need.
Meaningful metrics, useful logs, and easy-to-understand dashboards are complemented by tailored alerts. Some elements of great alerting include:
- A good title showing the actual event. For example, “The Web Server service in server so-and-so seems to be down!”
- Details of metrics or conditions that caused the alert to generate.
- Type of impact, and level of impact on the affected system(s). For example, “This means websites x, y, and z hosted in Web Server so-and-so will now be offline!”
- The level of the alert. For example, P1, P2, P3, etc., or “Critical,” “High,” “Medium,” “Low.”
- Links to the relevant dashboard(s) with further information.
- A few simple steps to follow to get the best outcome.
The goal of those alert elements is to reduce the outage duration by providing pertinent information to those who’ll respond to it regardless of their experience in the field.
Putting It All Together: Follow the Red String
Monitoring for troubleshooting is all about following the path of the error to find the root cause. This may be a latency issue of a microservice called from a web application, which can be traced back to CPU usage, memory, disk I/O, or network latency. The key is to get as much relevant information along the way as possible. The metrics and logs selected (and available in the dashboards) should provide sufficient information to analyze the error situation and discard false positives.
Even without major outages, monitoring can be used proactively to reduce cost, avoid future failures, and provide a more linear improvement path to IT infrastructure management.
Following the tips in the articles will allow you to have a better view of your infrastructure and map it to relevant events. The principles we discussed here not only apply to cloud platforms, but also to on-premises, hybrid environments, or IoT device fleets.
One of the advantages of using third-party solutions like SolarWinds AppOptics or Loggly for infrastructure monitoring is they’re not tied to a specific vendor platform and offer a wide variety of setups.
The best way to learn more about monitoring infrastructure metrics and logs together is to try it. Setup is quick and easy whether you’re adding log monitoring with Loggly or adding infrastructure monitoring with AppOptics, or both.