
We are excited to announce the general availability of SolarWinds® AppOptics™, the next-generation Software as a Service (SaaS)-based application performance management (APM) and infrastructure monitoring solution.
Today’s challenges
The way web applications are built, served, and maintained has changed significantly over the past decade. Complex environments that would have previously been near-impossible to manage and scale can now be deployed with ease thanks to containerization and cloud vendors like AWS®. With these advances, development and operations teams can focus their attention on building better applications.
However, achieving visibility into performance has become more challenging as infrastructure and application complexity has grown. Environments have become more dynamic given that ephemeral systems, horizontally scaling tiers, and other services now work together to power today’s applications. With so many moving parts, tracking down performance bottlenecks has become more critical—and complex.
Traditional APM and infrastructure monitoring tools have struggled to keep up. Important features are often missing, agents are too heavy to be used reliably in production, and costs are so astronomical that many teams simply cannot afford to purchase them.
Introducing AppOptics
SolarWinds AppOptics is our new SaaS-based APM and infrastructure monitoring solution, which is designed to provide complete visibility into your application’s performance, from the host to the code being executed, and everything in between. By combining next generation technologies from TraceView™ and Librato®, AppOptics gives you unparalleled insight into your servers and the underlying services running on them. AppOptics gives you code-level visibility into what happens as your application serves requests. It also provides access to custom metrics directly from your app, which can then be assembled into beautiful custom dashboards. Having single-pane-of-glass visibility into the metrics that are important for your app is a true game changer.
Instant-on APM
AppOptics offers best-in-breed language and framework support. Java®, Python®, PHP, and .NET are currently supported, and Ruby, Node.js®, and Go are available in Beta.
We have refined our APM instrumentation to modernize, optimize, and remove unnecessary complexity for leaner, faster monitoring, without impacting performance. No host agent is required, making it deployment-friendly in a variety of environments. We’ve also increased our data visualization with high-resolution percentile and histogram-based metrics without sampling. Now it takes just minutes to install our APM instrumentation and start receiving metrics from your language layer, frameworks, HTTP, and database calls, with no code changes required.
Distributed transaction tracing
Being able to follow a request as it traverses multiple services, known as distributed transaction tracing, is key to understanding the performance of distributed applications. AppOptics is designed to follow these complex requests across all of your microservices, allowing you to see the bigger picture, rather than each service’s metrics and logs being siloed and presented without context. HTTP calls between hosts are captured, along with associated POST data, so you can see exactly what calls are being made, and subsequent activity in the downstream service.

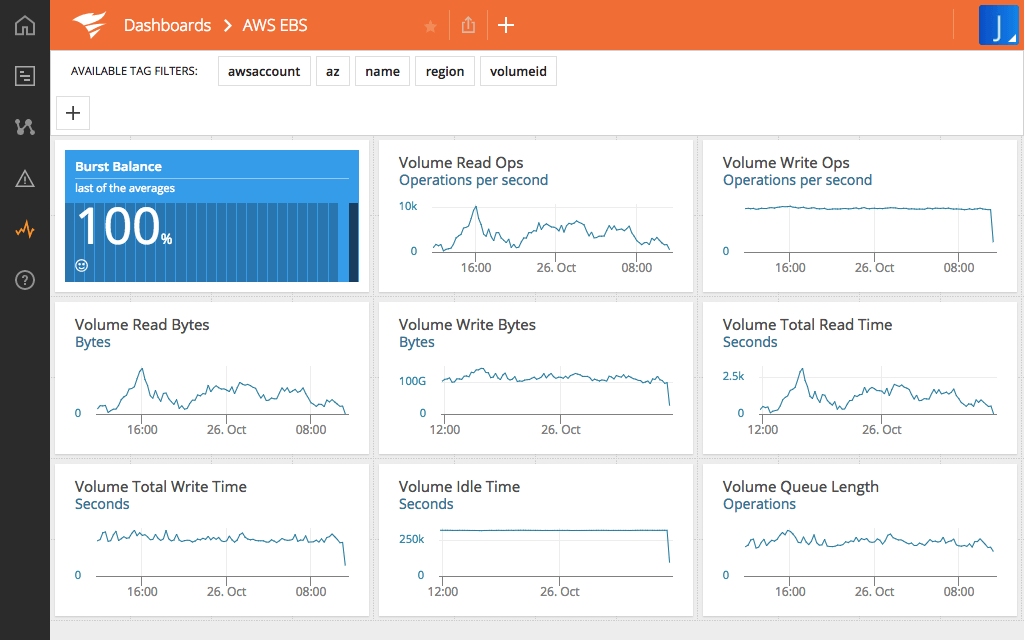
Infrastructure monitoring
It’s important to understand how your code is performing, but that only gives you one side of the monitoring story. You also need to understand what’s happening at the host and application levels. AppOptics provides a lightweight host agent based on Intel® Snap™, supported by a community of open-source plug-ins and integrations. Or, if you’re using a cloud host like Amazon Web Services™, you can pull CloudWatch® metrics with no agent deployment needed.
Infrastructure monitoring, paired with APM, means that alongside the average trace latency and error rate graphs on your custom dashboard, you can also have your host’s load average, memory usage, and metrics showing user activity within your application. If you’re using Docker®, AWS, Kubernetes®, MySQL®, or another supported platform, you can integrate statistics from these, too.

Custom metrics
Being able to see application responsiveness and infrastructure health is critical, but you may also want to include some bespoke data on your dashboard. For example, you may want to know how many logged in users are using your app, or average customer spend over time, or even the ambient temperature in your office. AppOptics provides effortless metric reporting, exposed via StatsD in the host agent, SDK exposed by our APM agents, a powerful REST API, and more. These metrics can be plotted in dashboards alongside your trace and infrastructure data. With AppOptics, correlating application usage trends against performance metrics is quick and easy. The bottom line is that it provides unprecedented insight into the overall experience.
Affordable pricing that scales
Finally, we want you to be able to use AppOptics everywhere, on all your hosts and in all your environments, so we have set a price point that any team can afford. With pricing starting at $7.50 USD per host/month, AppOptics delivers an unmatched combination of deep functionality and affordability. This breakthrough makes powerful application performance and infrastructure monitoring capabilities accessible to virtually all organizations. (Pricing is shown here in USD as of 11/20/17 and is subject to change.)
We also offer a blended host pricing model that can bring your costs down significantly by using both Pro and Enterprise hosts in the same account. Finally, the billable count of hosts is based on host hours, not the maximum count/high-water mark.
We encourage you to try AppOptics for yourself. Get a full-featured, 14-day free trial (no credit card required) now!