Note: This article was originally published on Librato, which has since been merged with SolarWinds®AppOptics™. Explore custom metrics you can track and analyze with AppOptics.
One of the things that makes collectd such an effective collector is all of the metrics it gives you with a minimal amount of effort. As I touched on in a previous blog post, we took extra steps by adding Service-Side Filtering to help our customers filter the collectd metrics we store on their behalf. However, there are still a number of “noisy” metrics where it might be desirable to condense them before publishing them to Librato.
If you’re capturing system-level metrics on a host with plenty of CPU cores, you’ve probably noticed that collectd breaks out each CPU metric (e.g., idle, steal, and user) for each core. For many users, these individual streams offer little benefit on their own. Fortunately, collectd includes some plugins that will help us aggregate each of these metrics into a single stream on the source host.
First, you’ll need to edit your collectd configuration to enable the aggregation plugin and add the following Plugin block. This directs collectd to aggregate each metric across all cores on a single host.
LoadPlugin "aggregation"

<Plugin "aggregation">
  <Aggregation>
    Plugin "cpu"
    Type "cpu"
    GroupBy "Host"
    GroupBy "TypeInstance"
    CalculateAverage true
  </Aggregation>
</Plugin>
Optionally, you can also enable “CalculateSum true” if you’d prefer to aggregate by sum instead of (or in addition to) average.
Next, you’ll want to enable the match_regex plugin. This configuration will filter out all of the per-core metrics from being sent to the output plugin. You must perform this step if you want to block these metrics from reaching Librato.
LoadPlugin "match_regex"

<Chain "PostCache">
  <Rule>
    <Match regex>
      Plugin "^cpu$"
      PluginInstance "^[0-9]+$"
    </Match>
    <Target write>
      Plugin "aggregation"
    </Target>
    Target stop
  </Rule>
  Target "write"
</Chain>
Note that the aggregation and match_regex plugins were introduced in collectd versions 5.2 and 4.6 respectively. Ensure that your installed package is at least version 5.2 in order to use both of these plugins.
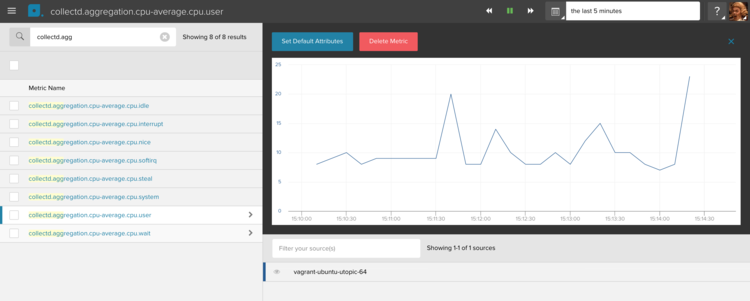
These aggregated metrics will arrive in the new format “collectd.aggregation.cpu-average.cpu.wait” so you’ll need to add a whitelist for them in the Other Plugins field. A good wildcard would be “collectd.aggregation.cpu-*.cpu.*“. Make sure to click Update to save your changes.


After restarting your collectd process and updating your whitelist you should begin seeing the new aggregate metrics in your Librato account. Once these have arrived you can safely delete the per-core metrics.

Finally, you’ll want to update the composite function of the CPU instrument in your collectd dashboard to take this change into account:
divide( [sum(derive(series("collectd.aggregation.cpu-average.cpu.idle", "%"))), sum(derive(series("collectd.aggregation.cpu-average.cpu.*", "%")))] )
For more tips on using collectd with Librato, check out our Knowledge Base articles. And as always, if you still have questions about this or any of our services, you can find us online in our support chat or email us at support@librato.com.