Note: This article was originally published on Librato, which has since been merged with SolarWinds®AppOptics™. Learn which APM metrics you can track using AppOptics.
Imagine for a moment that you have suddenly been promoted from regular old developer to senior architect, and tasked with overseeing the telemetry efforts for all of the engineering teams at your organization. I recently had a conversation at DevOps Days Toronto with someone who was living through exactly that experience. He’d just been put in charge of figuring out how to stabilize the efforts of 68 different development teams (!). By stabilize, he meant fix erratic behaviour of their product which was beginning to have large blocking outages.
His teams were all working on different parts of a single, large micro-services architecture, which had grown large enough that the individual development efforts for each service were growing apart and becoming siloed. Because he was known to be a friendly and talented engineer who’d contributed to many of the services individually, the business had decided to “DevOps” him, i.e., snap him off from his current team to focus on making the entire system work together better. He was happy to help, but having a hard time figuring out how to begin. He knew he wanted to get some data that would give him a good feel for where the problems were, but his question was—what specifically he should measure?
CPU, Memory, Network, and Disk Metrics Aren’t Great Teachers
Much has been written about the theory of choosing good metrics. I’ve written before, for example, that good metrics test systems hypothesis. By that, I mean that when we think about the systems we build, and how they should act (e.g., this queue should handle 50K writes per second, or that balancer should always choose the least loaded worker), good metrics confirm our valid assumptions, discredit our errors in judgement, and show us edge cases. They teach us about how the things we build actually work.
By this yardstick, the classic CPU/memory/network triumvirate is mediocre at best. You may have a meaningful hypothesis about how much RAM or CPU a process should use, and you may learn something about your creation (or more likely the underlying interpreter or OS or garbage collector) if your assumption isn’t borne out in practice. However, metrics that measure things like how long a particular database call takes, or count the total number of worker threads or queue elements, reflect assumptions that make for a more meaningful understanding of the thing you care about.
Let me give you an example. Say you’ve built a process that you expect will consume 4% of the CPU and 400 kilobytes of RAM per pool of 1000 DB Connections, but the production system running your process is using an order of magnitude more RAM and CPU than you’ve hypothesized. Have you learned something about your process, or have you learned something about the host running your process? The problem with metrics like CPU and Memory Utilization is that they measure the system, rather than your process. These metrics teach you more about the OS and runtime overhead than they teach you about what you actually care about.
How I Choose Meaningful Metrics From Scratch
Building a distributed system is not the same thing as understanding it, and experienced engineers can pretty often intuit how well an architecture is understood by the team running it. The evidence is everywhere: in how deeply we test our code, how specifically we monitor the services, how precisely we can derive our capacity plans, and even in how repeatably we can deploy our changes.
The newly appointed architect who asked the “where do I start?” question was an experienced engineer. He knew what made good metrics, and he knew the teams he was put in charge of syncing didn’t understand what they’d constructed. He didn’t need a lecture on theory, and he wasn’t going to waste any time asking the teams to identify their metrics. He had to get his own hooks in; the question was, quite simply, where?
Well, let me tell you what has worked for me in the past. Whenever I’m put in charge of a large and churning wad of software that I didn’t write, I draw a picture of it, and that picture inevitably comes out looking something like Figure 1. In fact, this is one of the actual pictures I drew when I was first hired, and trying to wrap my head around how Librato’s micro-services architecture works in practice.
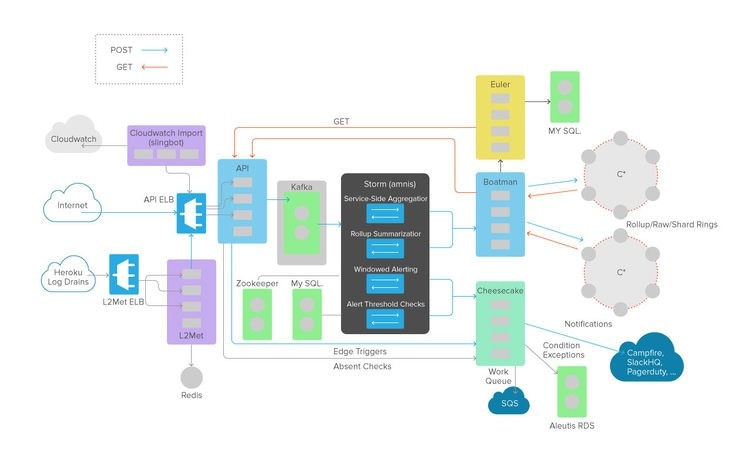
Figure 1
Step 1: Measure the Space Between the Services
Normally, we’d focus our attention on the boxes, and in the end we do want to know how each of these services work so we can derive some metrics that are key indicators of how well they’re doing their job. However, in this case, we’re going ignore the boxes completely. In fact, I’m going to delete all of these box labels, and instead label the lines. Above each line, I’m going to place a label that identifies the protocol each of those lines represents. This gives us Figure 2.

Figure 2
Check that out—our previously incomprehensible micro-services architecture just became a handful of commodity network protocols. Every application we build is a balanced equation; it’ll work fine as long as it is in balance, and eventually we’ll root out all of the things that can throw it out of whack. But for now, the best way to detect when it’s out of balance is by timing the interactions between its component parts—measuring the space between the services. Our strategy will be to figure out a way to time the interactions represented by each of these lines.
If I made that sound easy, it’s not. Getting these numbers, which I collectively refer to as inter-service latency data, is going to require a lot of engineering know-how. In almost every case, you’ll have to get into the source and add some instrumentation that wraps API or DB calls. Sometimes you’ll need to reconfigure a set of web servers or proxies, and every once in a while, you’ll need to write some glue code or API wrappers of your own.
You should wind up with a slew of numbers on the order of tens or hundreds of milliseconds. When something goes wrong with the application, these numbers will tell you where the problem is (in which service on which nodes). Note that this is not the same thing as telling you what the problem actually is, but we’ll get to that in a minute.
Of course, you’ll need to actually put all of this data somewhere. That’s the sort of thing I (and many other people) have written about at length, but it’s worth mentioning here that you’re going to need a scalable telemetry system to help you store and analyze all this stuff.
Step 2: Extract Knowledge From Your Latency Data
Play around with these numbers as you get each of them up and running. Note the baseline values, and search for patterns of behavior, and things that strike you as odd. Do some service latencies raise and fall together? Do some appear dependent on others? Do they vary with the time of day or day of week? As you discover these patterns, talk to the engineers who run the services and see if these patterns confirm their notions of how that service should work. It shouldn’t take long before you or someone else notices something in the data that causes you to say something like “huh”. This is the sound of scientific discovery. Dig into that service behavior with the help of the engineer who runs it, and you’ll likely encounter a meaningful metric or two.
When something goes wrong, look at the inter-service latency data and see how early you can identify things going sideways. The numbers tend to get big upstream of the services that are actually having trouble. Share your data with the engineers running those services, dig into the numbers together to figure out what went wrong, and you’ll likely encounter a good metric or two.
Step 3: Repeat
If that sounds more labor intensive and slower than installing a whiz-bang fully automatic APM, it is, but the juice—in the form of the insight you glean about your services and the metrics that embody that knowledge—is absolutely worth the squeeze. Effective metrics require attention and patience. They take some effort to identify, but each is a manifestation of insight; each teaches you something you didn’t know about the services you maintain; each is a thing to be prized, shared and talked about.
In the life of every engineer who deals with telemetry data, there comes a point where you want to stop messing around with monitoring tools, and start messing around with monitoring data. If you’re ready to transition your time away from managing your metrics infrastructure toward using your metrics infrastructure, sign up for a free trial today, and let us help you identify and track your key operational metrics.