

 Note: This article was originally published on Librato, which has since been merged with SolarWinds®AppOptics™. Explore what’s possible with monitoring application performance using AppOptics.
Test Driven Development (TDD) is not only a discipline we like to write about; we practice it ourselves every day. This is a blog post we shared with our friends over at Rainforest QA. Because we know you can’t enough of a good thing, we’re re-posting it here. Enjoy!
 SolarWinds® Librato™ is a prolific engineering shop. We range between 40-60 deployments per day. In fact, as I write this, so far today we’ve deployed code 40 times—12 of which were production changes (the others targeted for various staging environments). I can see all of these deployments in our corporate chatroom, because we use chatbots to push code into production.
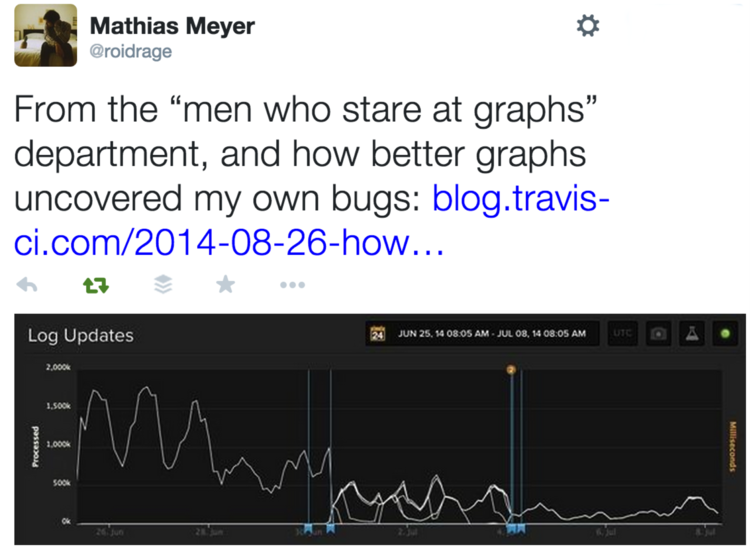
In fact, most of our interaction with the services that make up our metrics product are abstracted behind chatbots in one way or another. We receive notifications of new users and production problems from chatbots, we manage our feature-flagging via chatbots, and, perhaps obviously, we’ve integrated our Github and Travis-CI interactions into chat.
The upshot of all of this, is that when someone merges some code into a production repo, I can see it in group chat:


And not only can I see the change, I can see the change pass or fail its unit tests:

![]()
Besides seeing the test result, there’s even a link to the Travis output right there, so I can see everything that Travis did. Forgive me if I sound like I’m gushing—because I am. It all still seems so Sci-Fi to me, what with our chatbot (twke by name — literally named after the ambiquad in Buck-Rogers) instantiating a whole new computer to run hundreds of automated tests that are intended to vet my work before it’s automatically deployed onto the inter-cloud. But I say that as someone who still thinks MUD’s are pretty rad. YMMV.
How Many Tests are There?
I’ll pick on our alerting service, because it’s written in Go and (because it uses Go’s built-in testing framework) is easy for a knuckle-dragger like myself to inspect with grep.
find . | grep _test.go | wc -l
Yields 44 individual, test-laden files. Roughly one for every other .go-suffixed file in this repository, each one named for the unit it tests. Ergo, for foo.go, we find foo_test.go about half the time. Lightly poking into the files that don’t have an associated test file, I find mostly type definitions, and other data-structure related code (not the sort of thing you normally test directly).
grep -ri 'func Test.*(*testing.T' . | wc -l
Yields 172 individual tests. About a 4-1 ratio of total functions, to test functions.
find . | grep _test.go | while read i; do egrep -v '({|})' ${i} | grep '[a-z][A-Z]'; done | wc -l
Gives me close to 2400 lines of code devoted to tests. In fact, test-related code, makes up almost half of this repository measured by lines. So OK, we test a lot, but then all of us who work in continuous integration shops doing web operations/engineering work do nowadays (right?).
If you don’t practice continuous integration, these numbers might seem excessive to you. But then I’d also venture to guess that you are saddled with a burdensome and possibly politically-charged change-management process. A process that probably involves a weekly meeting where people who want to deploy production code propose and defend their proposed deployments to a room populated mostly by other people who are there to propose and defend their own changes.
Change control meetings are intended to protect healthy production environments from human error by instituting a layer of peer-review. Whether this works or not, is debatable, but it is unquestionably slow, and drains productivity. Long release cycles allow more time for development and production branches to diverge. Therefore, the classical change-control methodology, by slowing down the release cycle, tends to foster larger, more substantial (and thus more error-prone) changes.
Continuous integration by comparison relies on unit tests to produce healthy production environments free from human error by directly checking for errors. Viewed in this way, testing is the substrate upon which continuous integration is built. We can spend as much time on it as we might otherwise spend halting productivity to create change proposals and argue about them in a weekly meeting. Anyone with commit access can deploy to production as often as they like provided that their changes pass all of the unit tests. This makes for smaller, simpler, more stable changes, that are easier to roll-back in the event of a problem.
Good Tests Help Us Ship
 Of course, our tests can’t protect the production environment if they aren’t meaningful. In creating them, we generally need to be both procedural and selective. Like our Alerting service, all functional code should be organized into sections, and every section should have an accompanying collection of tests. But we need to select test criteria that genuinely help us ship quickly and safely.
Good Tests Add Context and Encourage Cooperation


If we make our tests too difficult, obtrusive, or meaningless, or if we try to enforce things everyone hasn’t already agreed to (like coding style), people will just work around them. Self-defeating behavior like this is more likely to emerge when we sequester test creation to a particular team. Tests should mostly enforce the expected operational parameters of the things we create. Everyone should craft them, because they help us all reason about what we expect from the things we build. Tests that we didn’t write should give us insight into new code-bases, rather than encourage adversarial relationships between engineers.
Good Tests Make Good Codebases

So, creating and maintaining good tests is both art and science. It requires us to reason about “correctness” when we design and create software, thereby making us cognizant of our own expectations and assumptions. Choosing good test parameters means thoroughly understanding not only what we’ve created, but also the difference between what we’ve created and what we set out to create in the first place. Testable code is usually well implemented code, and poorly implemented code, is usually hard to test.
Metrics-Driven Development?
There’s another class of code in this repository that’s neither functional to the application, nor related to unit tests. An example looks something like this:
metrics.Measure("outlet.poll.alerts.count", len(alerts))
This is instrumentation code, and grep counts a little over 200 lines of it in this repository. The idea behind instrumentation is to measure important aspects of the application from within. Instrumentation like this quantifies things like queue sizes, worker-thread counts, inter-service latency, and request-types. These metrics are then exported to a centralized system that helps us visualize the inner workings of our applications. Below for example, is the dashboard we use to keep an eye on our Alerting services metrics.


Good Metrics Help Us Ship
Unit-testing is like the sign that says we need to be this tall before we can deploy to production. Our metrics are more like a canary in the coal-mine. They are unit tests that can follow our code into production. They can continuously vet our assumptions about the changes we introduce. Like test-driven development, which uses carefully crafted unit-tests to verify correctness, metrics-driven development uses deliberately chosen metrics to directly show us the effect of our changes.
At Librato, we find metrics like these indispensable. They are the primary means by which we understand the behavior of our applications in the wild. As a result, we carefully choose the metrics we track, and perhaps unsurprisingly, our choices mirror our testing choices in fundamental ways.

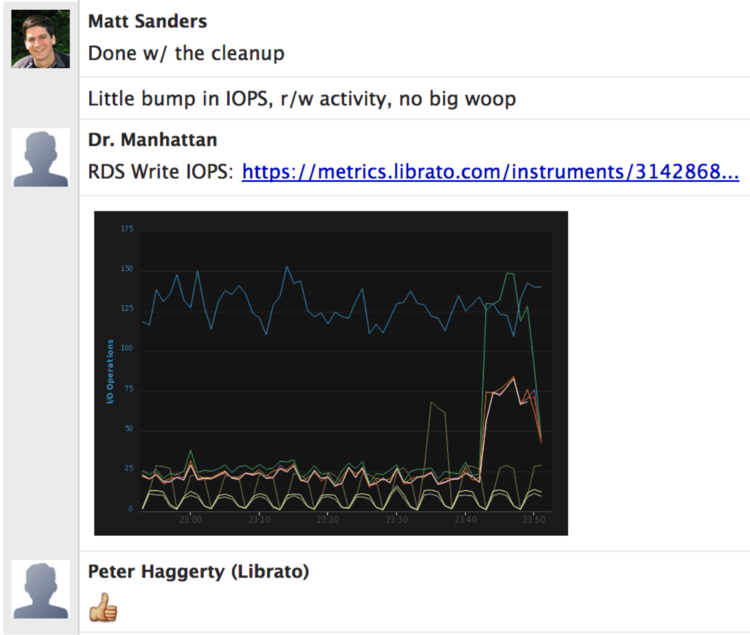
Like our tests, our metrics can’t protect the production environment if they aren’t meaningful. Continuous integration at Librato relies heavily on good metrics because they give fantastic visibility; they let us watch as the changes we introduce impact production entities.

Good Metrics Make Good Codebases
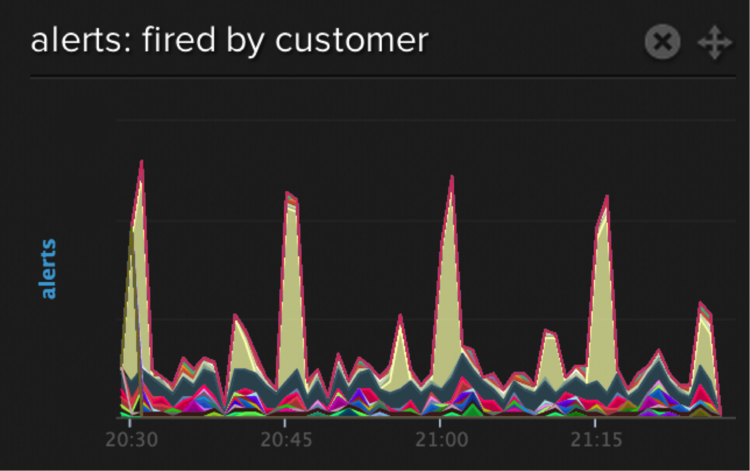
Good metrics test systems hypothesis. They confirm our expectations about how the things we build perform in real life. Just like tests, everyone should be able to choose and work with their own metrics, because they help us all reason about our expectations from the things we build. Metrics can teach us much about code bases that we aren’t familiar with. Without any documentation, I can infer many things from the metric above, such as this service sends alerts, the number of customers using it, the total and individual rates at which alerts are fired, and even the seasonality of the use-pattern.

So creating and maintaining good metrics is also art and science. Choosing meaningful metrics requires us to reason about “correctness” when we design and create software, but when we succeed, we gain ongoing operational insight that’s invaluable to everyone, whether they’re designing systems, regression testing, supporting infrastructure or shipping features.
Designing software with instrumentation is healthy. It keeps us cognizant of our own expectations and assumptions. Well measured code is usually well implemented code, and poorly implemented code is usually difficult to measure. At Librato we believe that if you create unit tests today, you already the skill and insight to choose and combine metrics into a powerful real-time telemetry stream that you can rely on to keep your customers delighted.