Over the past two decades, two trends have completely reshaped the IT landscape: cloud computing and microservices. With cloud computing, organizations of all sizes can provision infrastructure and run applications on a global scale within minutes. And with microservices, these organizations can deploy highly scalable distributed workloads just as quickly. As much as these paradigms have made software deployment more flexible, more scalable, and less costly, they’ve also made software environments incredibly complex.
With monolithic applications, monitoring was straightforward. You installed and maintained a service on each of your hosts to collect and store diagnostic data, such as logs and metrics. Today, infrastructures are dynamic and ephemeral; entire clusters can be provisioned on demand, and there’s no guarantee the systems running your applications today will be the same ones running them tomorrow. Monitoring these dynamic and distributed environments is impossible using traditional tools, but it’s possible with SolarWinds® AppOptics™.
In this article, we’ll explain how complexity is changing the way we monitor software environments and how SolarWinds AppOptics addresses these new problems.
The Growth of Complexity in Software
In the past, IT infrastructure typically consisted of bare metal servers or virtual machines. These systems were generally designed to be persistent, to be long-lived, and to host specific applications. It was relatively easy for teams to track which applications were running on which systems, and for the most part, infrastructure remained relatively static.
Today, much of this has changed. Containers became a popular method of packaging and deploying applications, which changed applications from persistent services installed on a host to short-lived, ephemeral processes capable of being deployed and decommissioned as needed. Kubernetes applied this same philosophy to the cluster, allowing teams to treat fleets of machines as a single pool of resources. This added a great deal of reliability and scalability, and it also added multiple layers of abstraction and automation. It no longer mattered where applications were running; it only mattered whether they were running well, which required a shift in the way we approach monitoring.
The move to the cloud added its own challenges. Cloud platforms offer varying levels of insight into their operations and zero insight into the underlying infrastructure. The types of observability data you can collect from a virtual machine are much different than those you can collect from software as a service (SaaS). While cloud monitoring services like Amazon® CloudWatch and Google® Stackdriver™ can collect this data for you, learning these different tools can be a challenge for organizations migrating to the cloud. And if you’re adopting a hybrid or multi-cloud architecture, utilizing several tools for observability creates an even greater challenge.
With regard to monitoring, this means we now need to account for the following:
- Application performance
- The platform(s) managing our applications, such as Kubernetes
- The infrastructure these platforms run on, such as Amazon Web Services® or Google Cloud Platform™
How SolarWinds AppOptics Can Help
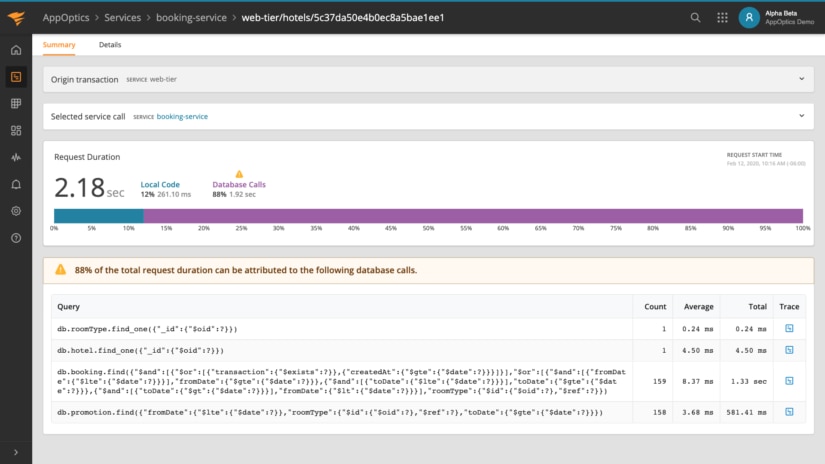
SolarWinds AppOptics is a comprehensive monitoring solution designed to support infrastructure and application monitoring. With AppOptics, you have full visibility into your applications, orchestration tools, and cloud platforms from a single interface. AppOptics also provides simple to read root cause summaries to pinpoint the likely cause of performance issues.
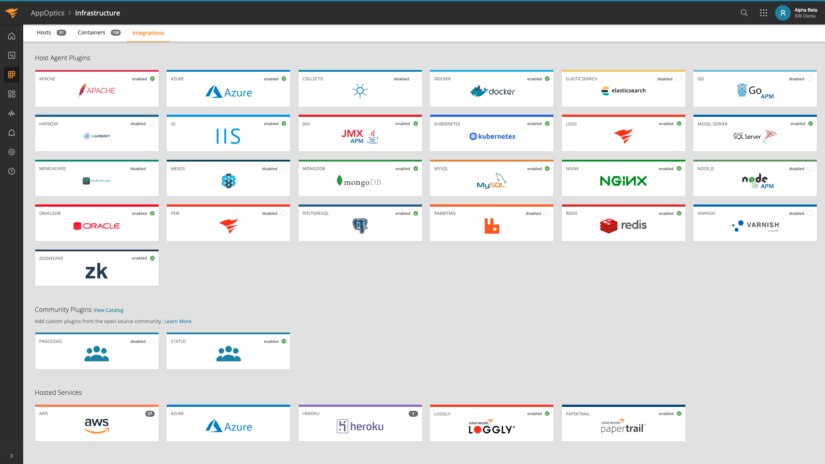
For complex, dynamic, and distributed environments, AppOptics is an easy way to oversee your entire infrastructure without having to navigate to different platform portals or learn multiple monitoring solutions. You can access logs, metrics, and traces for your applications and systems from a single location. Shipping observability data to AppOptics is as easy as installing the SolarWinds Snap Agent to your hosts; using the AWS CloudWatch, Azure® Monitor, or Heroku™ integrations; or using one of the many other product and service integrations. You’ll immediately start seeing aggregated data from across your environments, no matter where your applications are deployed.
You can view your entire application, infrastructure, or both using detailed out-of-the-box and customized dashboards or drill down into individual components for more advanced debugging and troubleshooting.
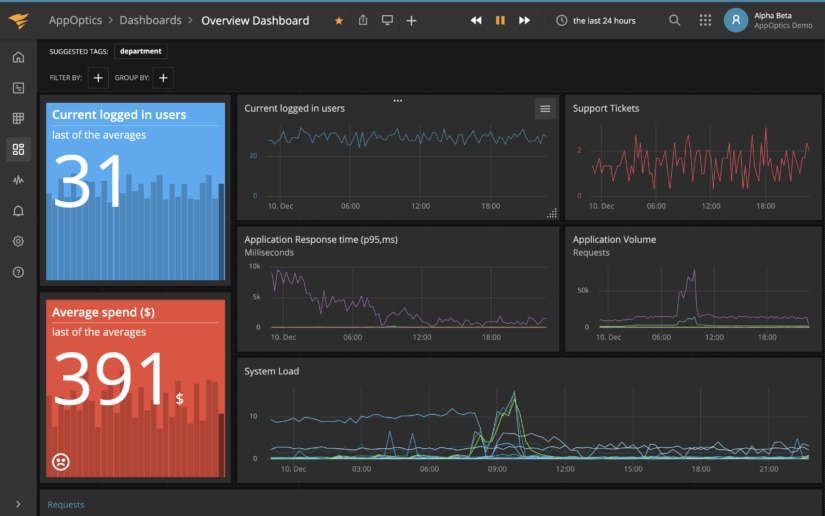
Example of a SolarWinds AppOptics dashboard showing application, infrastructure, and custom metrics; real-time statuses; and trends.
Conclusion
Modern environments may be complicated, but monitoring them doesn’t have to be. AppOptics allows you to oversee the health, performance, stability, and responsiveness of your distributed environments at a glance.
If you haven’t experienced the simple-to-install and easy-to-use AppOptics, maybe now is the time. With this tool, you can easily understand your applications and infrastructure no matter how complex your environment is. To get started, sign up for a 30-day free trial.