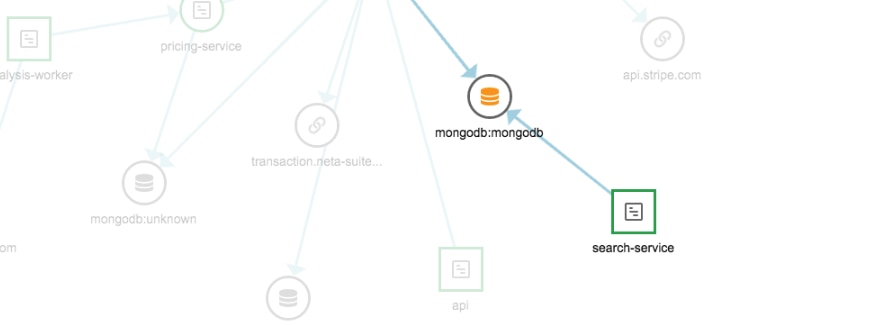
A comprehensive set of turnkey infrastructure integrations

Including dozens of AWS and Azure services, web, database, network, containers, orchestrations like Docker and Kubernetes, and more.

START FREE TRIAL

Complete visibility into the health and performance of applications and their underlying infrastructure

Quickly pinpoint the root cause of performance issues across the stack, down to a poor-performing line of code

START FREE TRIAL

Custom metrics and analytics

Analyze custom infrastructure, application, and business metrics

View Custom Metrics Monitoring Info
Powerful API that makes it easy to collect and create any custom metric

Achieve ultimate visibility and enhanced troubleshooting with synthetic and real user monitoring

START FREE TRIAL

Free APM Software

Catch bugs early on, and gain full visibility and insights into the applications you’re developing

View Product Info
Free, full-function APM tool for testing and troubleshooting application performance before moving into production

Dev Edition includes five traces per minute, 100 metrics, three hosts, and six containers

GET FREE TOOL

Log Management and Analytics powered by SolarWinds Loggly

Integrated, cost-effective, hosted, and scalable full-stack, multi-source log management

View Log Management and Analytics Info
Collect, search, and analyze log data in addition to your metrics and traces to quickly pinpoint application performance problems

Reduce mean time to resolution (MTTR) by quickly jumping from a trace or host view into the relevant logs to accelerate troubleshooting

START FRE TRAIL

Digital Experience Monitoring Powered by SolarWinds Pingdom

Make your websites faster and more reliable with easy-to-use web performance and digital experience monitoring

View Digital Experience Monitoring Info
Add client-side web application performance monitoring. Provide maximum observability by adding the user’s perspective.

Achieve ultimate visibility and enhanced troubleshooting with synthetic and real user monitoring

START FREE TRIAL

Integrating APM with CI/CD workflows

Code deploys. Infrastructure changes. Cloud migrations. These are just a few examples of common events that can drastically affect how your applications perform. In the fast-moving world of DevOps, engineers are constantly implementing changes and adjustments to their environments to fix issues and improve performance; it’s important to be able to quantify the effect of these changes, and create awareness of them. SolarWinds® AppOptics can help facilitate this, by using annotations.

Annotation events, written to an annotation stream, can be used to signify events occurring within your environment. Using the AppOptics API in conjunction with your CI/CD toolchain, you can record events/changes such as those listed above, allowing their effects to be correlated against any number of metrics being captured and viewed. Did a dodgy code deploy cause your response time or error rate to spike? Annotations make it easy to identify these patterns.

AppOptics has long had the ability to receive annotations and build them into your dashboard views, but to make this feature even more useful, we’ve now given each of your APM services it’s own dedicated annotation stream and built it directly into the APM Service Overview page. For this example, we’ll be looking at an APM service called the ‘web-tier’, and the event we want to annotate in AppOptics is a new code deployment. To record this event, we simply make a HTTP POST to the AppOptics API, to the ‘/annotations/web-tier’ endpoint:
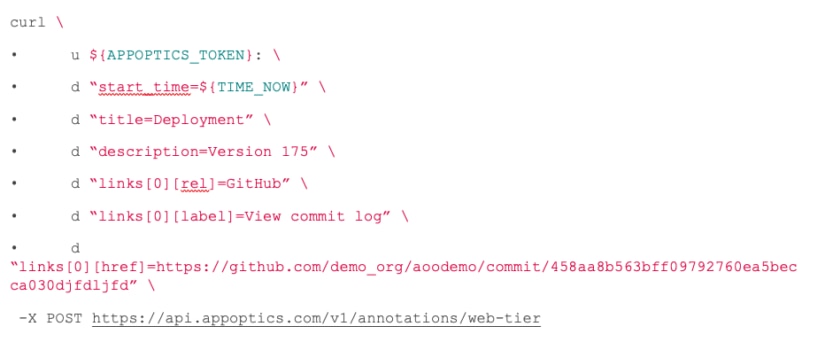
(our Ruby and Python API clients also have annotation capabilities!)

Now, when I take a look at my ‘web-tier’ APM service, I’ll see this event notarized on the Response Time Breakdown chart. As with all other metrics in AppOptics, annotations have a retention of 18 months, allowing you to go back and look at the effects of historic changes.

APM Service annotations are available for you to try out in AppOptics now.

Related articles

© 2024 SolarWinds Worldwide, LLC. All rights reserved.