Note: This article was originally published on Librato, which has since been merged with SolarWinds®AppOptics™. Explore how to integrate StatsD with AppOptics.
What Is It?
StatsD is a simple, lightweight daemon process, written in Node.js (although implementations exist in several languages like C and Go). It listens for metric values on a UDP socket in a simple, text-based format, aggregates multiple metric values internally, and flushes the result to pluggable back-end services, including Librato. It is simple to install and use, and has a wealth of third-party clients and language bindings. StatsD is a great fit for you if:
- You want to instrument latency-sensitive pieces of your application like request paths and database queries without adding overhead or implementing metrics-related threads in-process.
- You are using a slew of different monitoring tools, system architectures, and programming languages, and you want a simple, common interface to store the data in a popular data storage and visualization back end like Librato.
- You would like to track percentiles, like the 95th or 99th, across large numbers of metric samples.
- You want to count occurrences of things like the frequency, or elapsed time of function calls occurring inside your application across any number of servers, processes or threads.
How Do I Install It?
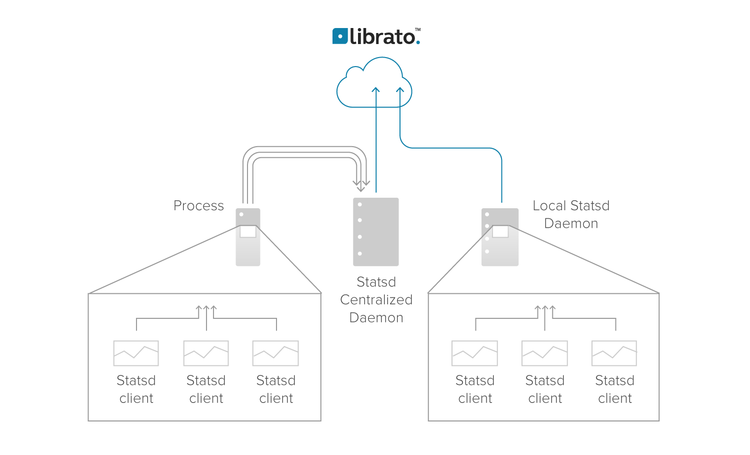
StatsD is composed of two pieces, a server daemon, and one or more clients. The daemon process listens on a UDP socket for incoming measurements, and periodically flushes them to a storage back end. Clients are usually implemented as StatsD language-bindings that make it easy to send metrics to the daemon from your chosen programming language. Because StatsD has become somewhat of a reference language for metrics collection systems, it is increasingly common to find StatsD plug-ins for popular monitoring systems, or applications that you’re likely to want to extract metrics data from. Examples include the Collectd plug-in for StatsD, and the NGINX plug-in for StatsD.
Installing The Daemon
Before you install the daemon, you need to decide where to put it. You can run StatsD on individual monitored hosts, listening on the loopback device for metrics from a locally-resident application that you have instrumented, or you can run it centrally on a network, listening at a known UDP address for metrics from remote hosts.
Running a centralized StatsD on an internal network means that you can provide a simple common interface that anyone in the organization can use to inject new metrics into the visualization system. When StatsD internally aggregates metrics it will be able to calculate statistics, like percentiles, across all the requests made within your organization.
If you are able to bake a StatsD installation into your host configuration, then running an instance of the daemon per-monitored host also has advantages. Because StatsD uses UDP in the transport layer it is possible that you will lose metric data on the wire if you run a single, centralized StatsD. The likelihood of data loss increases on WAN links, so centralized implementations should be carefully planned. Also, as your use of StatsD increases, you may find that one centralized instance becomes a single point of failure and a scaling bottleneck. An instance of the daemon per-monitored node can scale better as the number of nodes increases, at the trade off that some metrics must be aggregated at visualization time.
To install the daemon on your desired location, ensure you have the most recent version of Node.js, and then use the following NPM command:
npm install statsd
Installing The Client Libraries
A definitive list of StatsD client libraries is maintained at the StatsD project’s wiki page (under Client Implementations). Installation instructions for each client library is language dependent and linked from the wiki.
How Does It Work?
StatsD generally follows the process emitter pattern. The StatsD clients purge each metric as it is captured via a non-blocking channel, in this case, a UDP socket.

Flush Interval
The StatsD daemon has a configurable flush interval that defaults to 10 seconds. Any measurements that are received will be stored and aggregated for the duration of this interval. The method used to aggregate each metric depends on the datatype of that metric. When the flush interval expires, all stored metrics are flushed to the pluggable back ends.
Data Types
See the official documentation for more information, but the basic types are:
Counters:
StatsD counters are used to increment or decrement a value. They are sent in the form + or – n, where n is the number of times to increment or decrement the value ( n defaults to one). These are handy when you’re measuring occurrences of something across servers, because none of your individual servers need to know the current value of the counter in order to increment it.
Given a counter metric, StatsD will track the counter value, as well as compute its rate over time. The counter value is computed by keeping a running count, and the rate (values per second) is computed as the total value of the counter divided by the flush interval.
Gauges:
StatsD gauges indicate an arbitrary value at a given point in time. Once a gauge value is created, it can be incremented like a counter by “signing” it ( prefixing it with +|- ). Multiple gauge values are aggregated by dropping all values but the most recent. The last value wins, so if you create a gauge of value 5, increment it using +5 to 10, and then send another measurement of 7, the 7 will win. No other values are computed, and the most recent gauge value will be flushed to the back end every flush interval.
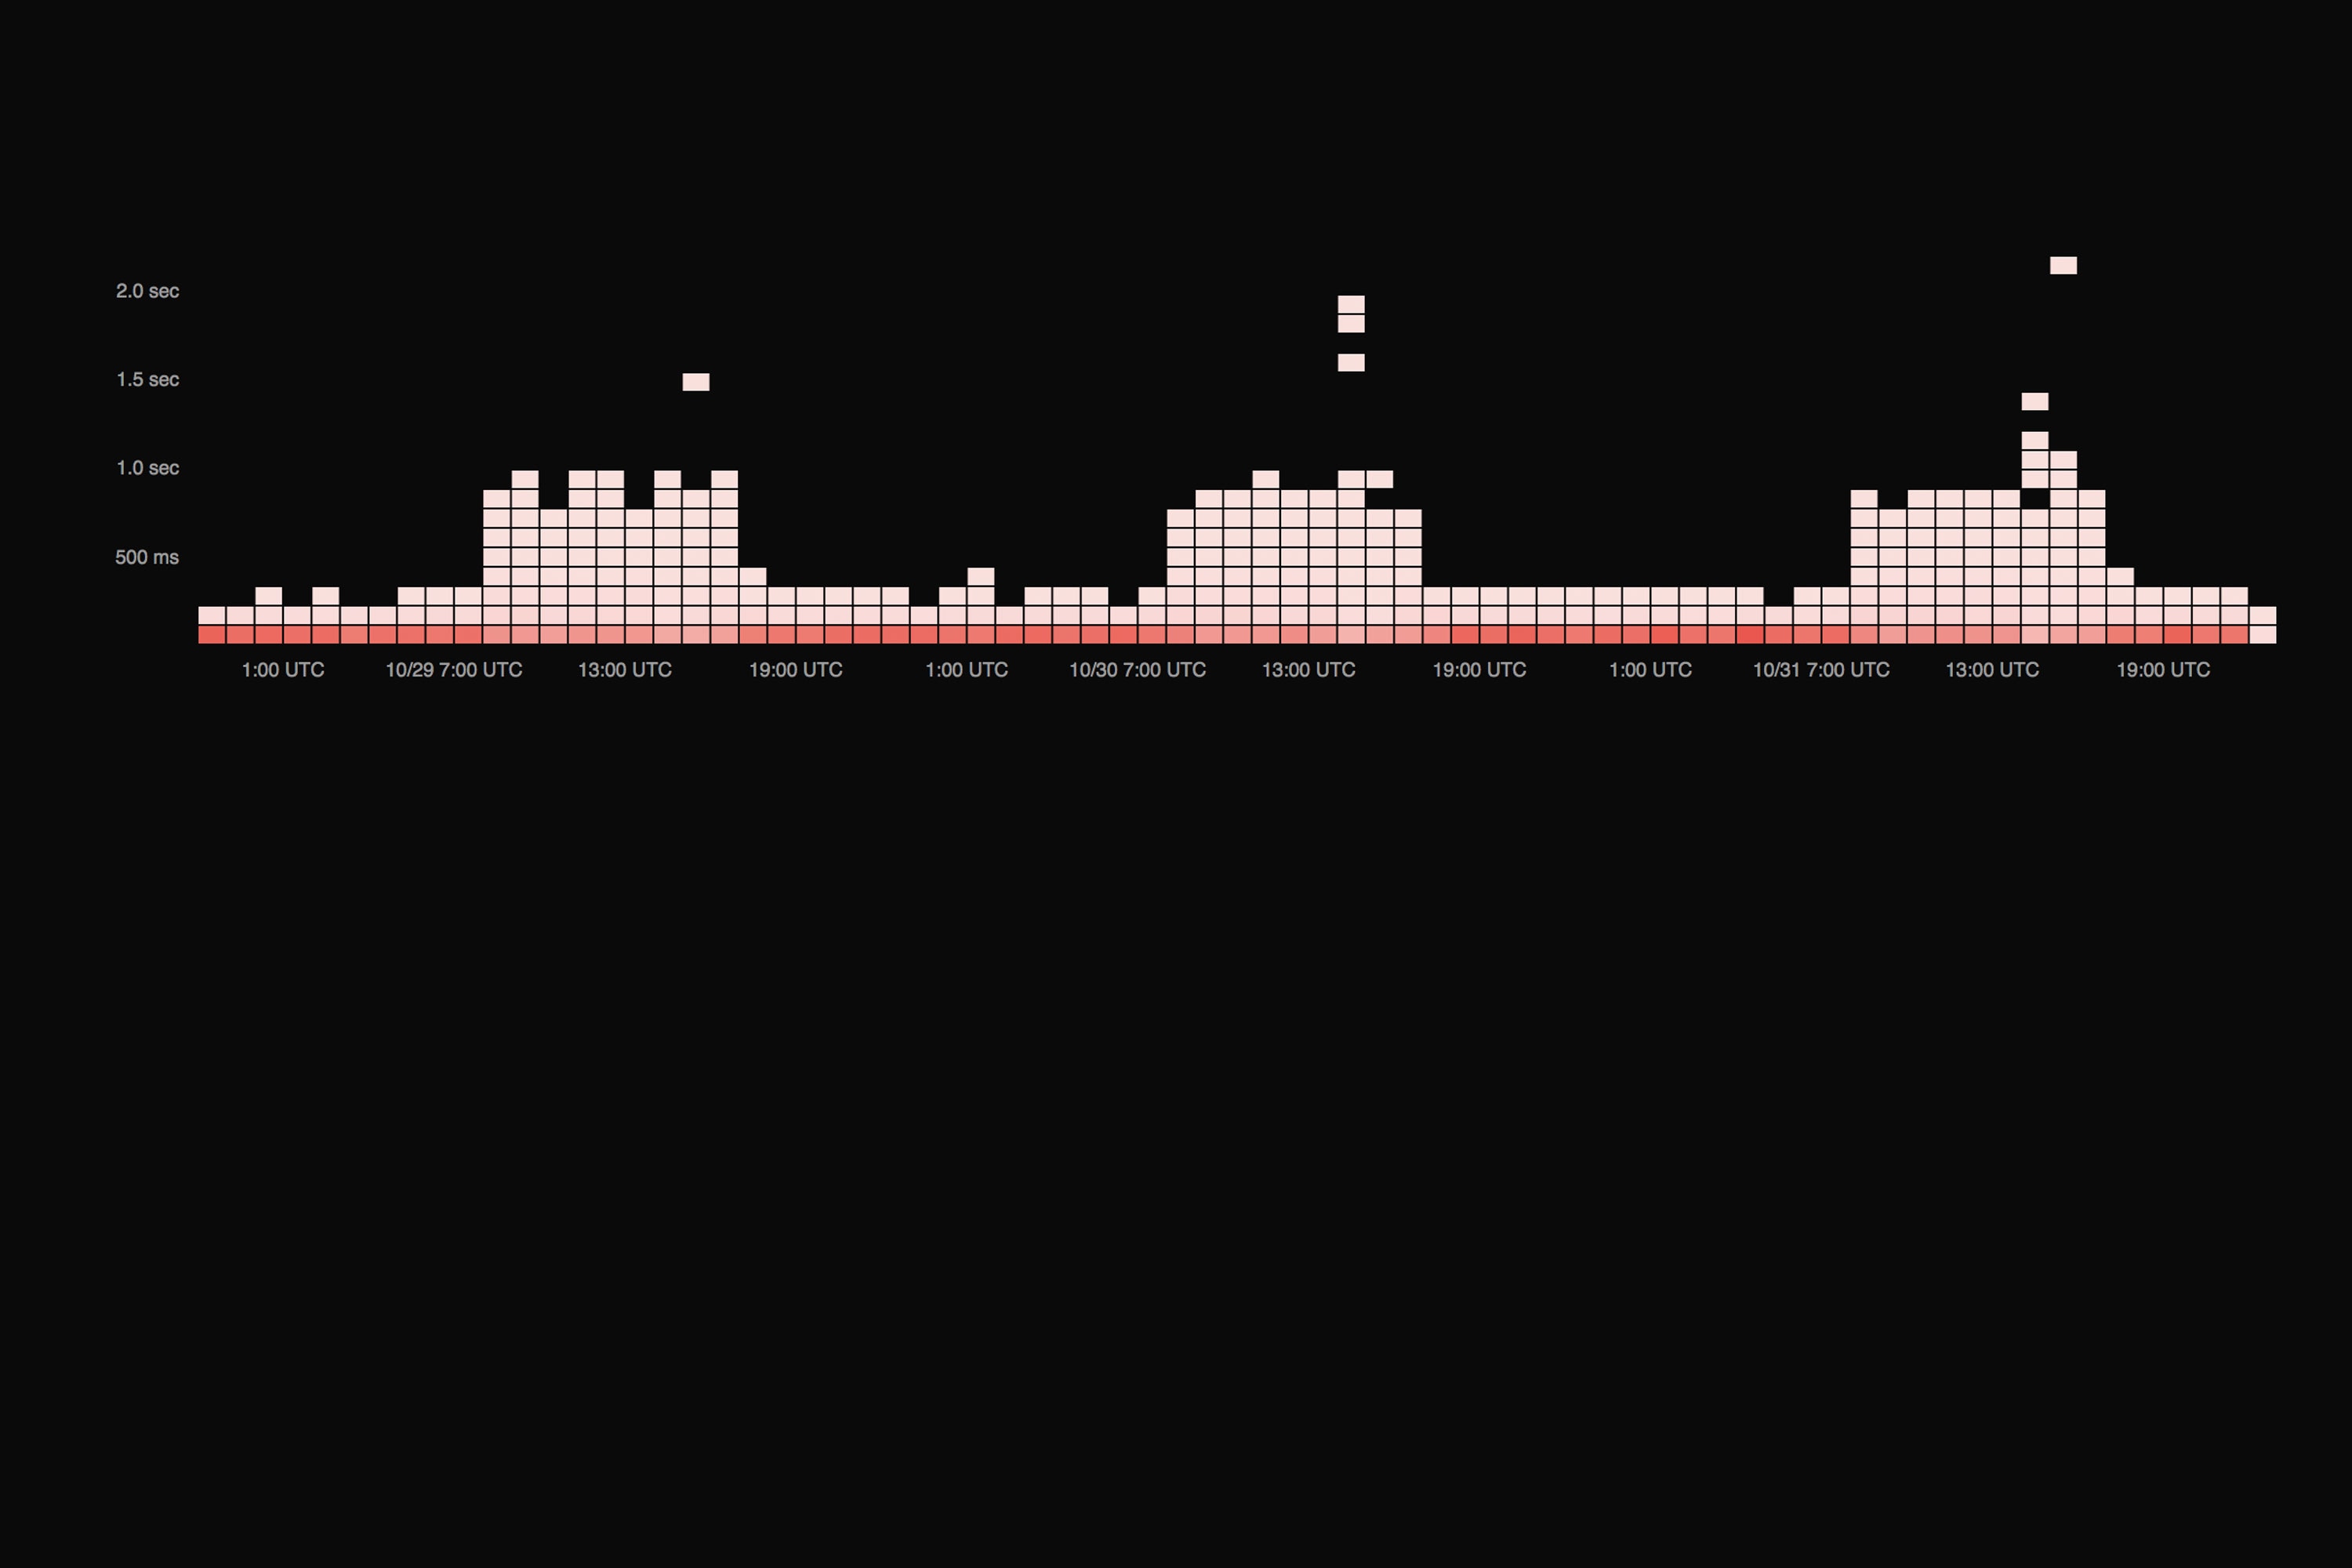
Timers:
StatsD timers are intended to record the duration of interesting events. They are often used to measure the length of time a function call or database query takes to complete inside an application. StatsD computes myriad summary statistics for timer values received during the flush interval. These include the mean, sum, count, min and max, as well as the 90th percentile for all of those stats. StatsD can be configured to provide additional percentiles for timers. All of these stats are flushed to the back end every interval.
Input
StatsD uses a text-based wire-protocol of the form: dotted.metric.name:[+,-]value|type[|rate]
Metric names use dots to signify hierarchy. Values are expressed as numerals optionally prefixed by + or -. Valid types are: “c”, “g”, and “ms”. Here are three examples of the wire format in this sample shell script that uses netcat to send three measurements one counter, one timer, and one gauge to a StatsD daemon listening on localhost (Script copied shamelessly from here):
nc -w 1 -u 127.0.0.1 8125 << EOF
metrics.api.globs:1|c
business.functions.glork:320|ms
system.cpu.goblets:14.2|g
EOF
Output
StatsD outputs aggregated metrics using a pluggage backend API that allows metrics to be sent to multiple time-series storage systems. It was originally designed to talk to Carbon as its back-end storage system, but thanks to the handiwork of Mike Heffner from Librato, it now has a pluggable back-end architecture that allows the use of many different kinds of back ends. See the full list for more detail.
Librato Back end
Librato’s open source StatsD back end enables StatsD to output directly to the Librato API. It is written in javascript, and installs using NPM like so:
cd /path/to/statsD
npm install statsd-librato-backend
The Librato back end is simple to configure; the default config consisting of just 3 attributes:
{
  librato: {
    email:  "myemail@example.com",
    token:  "ca98e2bc23b1bfd0cbe9041e824f610491129bb952d52ca4ac22cf3eab5a1c32",
    source: "unique-per-StatsD-instance"
  }
}
Hints, Trade-offs, and Gotchas
Timers, Not Just For Time
Given the nomenclature, it’s an understandable and common misconception that the ‘timer’ datatype can only be used for timing things. In fact, the ‘timer’ data-type can be used for any sort of data for which you want histogram-like stats like percentiles computed. Timers are handy for metrics that track size, magnitude, and temperatures. Really, the only limit is your imagination so feel free to play around. As of this writing, the StatsD developers are actively discussing proper histogram support, and the future of the timer datatype.
Mind The Retention Gap
Whichever back-end storage system you use, you should be careful to ensure that the storage schema used by your database stores data at intervals of time equal to or below StatsD’s flush interval (which defaults to 10 seconds). There are several last-update-wins senarios wherein you might end up with misrepresented data in some data-stores. The Librato API however, handles out-of-order and late data samples by design, so there’s no need to worry about the retention gap if you’re using the Librato back end.
Special thanks to Etsy’s Senior Software Engineer and Toolsmith Daniel Schauenberg (@mrtazz), who was kind enough to lend a hand in the editorial review of this piece. Thanks Daniel!