Graphios is the fifth installment to our Collector Highlight Series. We started the series with an overview of the patterns employed by the various data collections tools available, with additional posts including StatsD, collectd, and Heka.
 Note: This article was originally published on Librato, which has since been merged with SolarWinds®AppOptics™. Check out what’s possible with AppOptics APM tools.
What Is It?
Graphios is the easiest way to connect Nagios to systems like Librato and Graphite. If you need to emit metric data from Nagios to one of the newer graphing tools like InfluxDB or OpenTSDB, Graphios (via StatsD) is the only option other than coding up something yourself.
Graphios works as a glue layer between Nagios and various time-series databases. It uses the host_perfdata and service_perfdata hooks (defined in your nagios.cfg) to capture metrics in your perfdata log, then formats and sends them to systems like Librato, StatsD, and collectd. Graphios uses a modular backend system to support various metrics storage systems via a series of plugins.


How Does It Work?
Although its initial configuration may seem complex, Graphios is conceptually a very simple special-purpose log parser. It runs as a daemon, waking up on a configurable interval, checking for new performance data logs exported by Nagios, and processing them.
Graphios has a modular back-end model which allows it to write to multiple metrics systems. When Graphios finds a new performance data file, it parses metrics out of it, computes appropriate metric names for the enabled back-end plugins, and then emits the metrics to each back-end metrics system as required.
How Do I Install It?
Graphios is a Python program, so the easiest way to install it is with pip:
pip install graphios
It’s also pretty easy to install Graphios manually. First, get the most recent
version from git with:
git clone https://github.com/shawn-sterling/graphios.git
Then copy the various files to the appropriate locations:
mkdir -p /etc/graphios
cp graphios*.py /usr/local/bin
cp graphios.cfg /etc/graphios/
Configuration Requirements:
To get Graphios up and running, you’ll need to manually configure three things:
- The Nagios config files that deal with host and service checks
- The nagios.cfg
- The graphios.cfg file
If you installed with pip, the setup.py script will attempt to detect and automatically add a commented-out configuration to your nagios.cfg. The setup script does a pretty good job of creating this configuration on all but the most bespoke Nagios setups. All you should need to do is uncomment the new syntax and restart Nagios. Given the configuration flexibility of the Nagios however, it’s possible that you’ll need to manually intervene and modify the nagios.cfg yourself.
Designing and Configuring a Metric Name Schema
Nagios is a stand-alone monolithic system in that it assumes its check-command output will never be exported—that no system but Nagios will ever need to process it. So Nagios services generally have fairly simple names like PING, or LOAD. Because all of the necessary context is inside the Nagios UI, it should be obvious to the operator what those names refer to.
Graphing systems like Graphite, however, are not monolithic; they’re designed to work alongside other monitoring systems and data collectors. Therefore, they necessarily assume that all data is sourced externally (everything comes from some other monitoring system), and as a result they use dot-delineated, hierarchical metric names like Nagios.dc4.dbserver12.LOAD. In Graphite, a name like LOAD doesn’t tell the operator anything about what system the metric refers to, much less how it was collected.
To be an effective glue layer, Graphios gives you a simple, transparent means to translate Nagios’ simple, monolithic service names into context-rich hierarchical names that can be used by systems like Librato and Graphite. Specifically, Graphios can read metric prefixes and suffixes out of your Nagios service and host definitions using custom attributes. For example, a typical Nagios service description, excluding the minutiae normally packed into upper-level templates, looks like this:
define service{
   use                  generic-service
   host_name            box1,box2,box3
   service_description  SSH
   check_command        check_ssh
}
The output of the check_ssh plugin looks like this:
SSH OK - OpenSSH_5.9p1 Debian-5ubuntu1 (protocol 2.0) |
time=0.009549s;;;0.000000;10.000000
Everything after the pipe is performance data; these are the metrics Graphios exports. In this case, we have a single metric called “time”, which measures the response time of the ssh port (in this case, the ssh port responded to the check_ssh plugin in 0.009549 seconds). Graphios automatically prefixes the metric name with the host name, so without doing anything at all, our metric name becomes:
box1.time
As we’ve already observed above, box1.time isn’t a particularly meaningful metric name, so we can tell Graphios to put some additional context in front of this metric name by inserting a _graphiteprefix custom attribute into the service definition like so:
define service{
   use                     generic-service
   host_name               box1,box2,box3
   service_description     SSH
   check_command           check_ssh
   _graphiteprefix         nagios.dc1
}
Graphios will now prepend this prefix to the metric name, making it:
nagios.dc1.box1.time
This is a little bit better, but we can insert some additional context about the service between the host name and the metric name using a _graphitepostfix custom attribute in our service configuration like so:
define service{
   use                  generic-service
   host_name            box1,box2,box3
   service_description  SSH
   check_command        check_ssh
   _graphiteprefix      nagios.dc1
   _graphitepostfix     sshd.rt
}
Now, Graphios will insert ssh.rt between the host and metric name, making it:
nagios.dc1.box1.sshd.rt.time
At this time, we have a pretty decent metric name for use with systems like Graphite and StatsD.
Librato and the Source Dimension Exception
In Librato, metrics are first-class citizens which is a very nice feature that enables the use of dynamic dashboards and templates. Graphios correctly supports the Librato source dimension by submitting host-names like box1 to Librato as the source dimension, rather than hard-coding them into the metric name. So, continuing with our example, the metric name submitted to Librato therefore becomes:
nagios.dc1.sshd.rt.time
Any graph displaying this metric would then automatically depict one line for each source (three lines total, one each for box1, box2, and box3).

Configuring the Nagios Perfdata Hooks
Next, we need to configure Nagios to export performance data to a log file in a format that Graphios can understand. If you installed Graphios using pip, check the bottom of your nagios.cfg file for a block of configuration that begins with:
# ###### AUTO-GENERATED GRAPHIOS CONFIGS
If you aren’t already using Nagios perfdata hooks for something else (i.e., if you’re currently running Nagios configuration contains: process_performance_data=0), you can simply uncomment this configuration block, and restart Nagios. If you’re already using Nagios perfdata hooks for something like PNP4Nagios, or one of the other RRDTool-based graphing systems, chances are you can safely run both Graphios and your current toolset at the same time. Refer to the Graphios documentation for instructions on how to set this up.
If you didn’t install with pip, or if you don’t see a block of Graphios config at the bottom of your nagios.cfg, then you’ll need to manually enable performance data, and configure it for Graphios. Refer to the Graphios documentation for instructions on how to set this up.
Once you’ve configured Nagios to emit performance data, restart the Nagios daemon and verify that it’s writing a log file to the Graphios spool directory (named by the service_perfdata_file attribute in your nagios.cfg) with a name like service-perfdata.1418637947. The file should contain lines that look like this:
DATATYPE::SERVICEPERFDATA
TIMET::1418637938
HOSTNAME::box1
SERVICEDESC::SSH
SERVICEPERFDATA::time=0.066863s;;;0.000000;10.000000
SERVICECHECKCOMMAND::check_ssh
HOSTSTATE::U
HOSTSTATETYPE::HARD
SERVICESTATE::OK
SERVICESTATETYPE::HARD
GRAPHITEPREFIX::nagios.dc1
GRAPHITEPOSTFIX::sshd.rta
Configuring Graphios
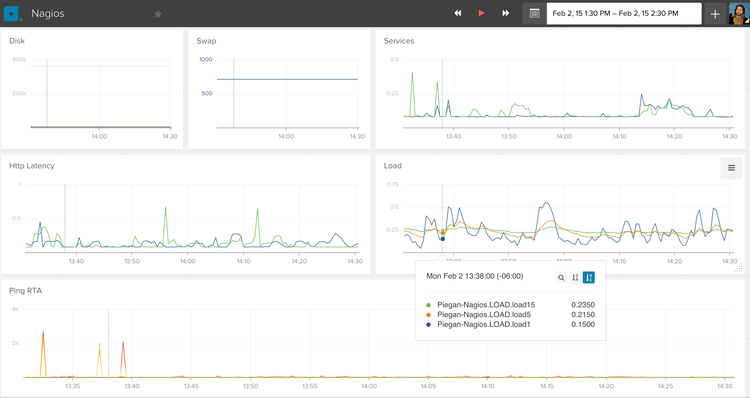
Graphios installs its config file in /etc/graphios/graphios.cfg by default. This file is very well commented and, for the most part, self-explanatory. There is a global configuration section, and one section for each backend plugin that Graphios can write to. Plugins are generally enabled by setting their enable line to True and configuring the required attributes for the plugin. Here, for example, is a working configuration for Librato:
enable_librato=True
librato_email = dave@librato.com
librato_token = ecb79ff8a82areallylonggreatbigstringtokenything6b8cb77e8b5bb98934cf7
librato_whitelist=["load","rta","swap"]
The whitelist attribute bears mentioning since, without it, Graphios emits all performance data measured by Nagios to Librato, which could become expensive. As configured above, only metrics matching the regular expressions: “load”, “rta”, and “swap” will be emitted to Librato. Here’s a working configuration for StatsD:
enable_statsd=True
statsd_servers = 192.168.1.87:8125
You may enable multiple backend plugins (Librato AND StatsD), and even multiple comma-separated instances of the same backend plugin (four different StatsD servers, and a carbon server), and Graphios will happily parse out and emit your Nagios metrics to each back-end system. At this point, you can run Graphios from the command line and see if everything works as expected:
graphios.py --verbose
Daemonizing
Graphios ships with init scripts for Debian and RPM-based systems. These were installed automatically if you installed with pip on a compatible system. Check the Graphios documentation for more information on starting and running Graphios.
Hints, Tradeoffs, and Gotchas
If Graphios successfully sends all of the metrics in a file to every back-end, it deletes the log file. Otherwise, it keeps the performance data log, and tries again the next time it wakes up. This is generally good operationally-robust behavior, but it’s possible to get into the situation where some number of performance-data logs are never deleted and begin to bog down Graphios by forcing it to reprocess the same files over and over.
You can safely manually delete these files from the spool directory using, for example,
cd /var/nagios/spool/graphios && find . -mmin 60
or by using the nerf attribute in the graphios.cfg to label certain back-ends as non-critical.
For example, if you set nerf_statsd=true in the graphios.cfg, and Graphios fails to send some data to Statsd, Graphios will delete the performance data file anyway, and that data will simply never be sent. This is often an acceptable trade-off for performance metrics sourced from Nagios, which are usually collected on the order of minutes anyway.
Get Started!
If you’re running Nagios today, and you’re still trapped in the RRDTool era, you owe it to yourself to install Graphios and experience the future of scalable metrics analysis systems like Graphite, InfluxDB, and OpenTSDB.