

 Note: This article was originally published on Librato, which has since been merged with SolarWinds®AppOptics™. Learn more about collecting and analyzing performance metrics with AppOptics.
Our Highlight on Collectors series will introduce and document time-series data collectors. Join us each month or so as we analyze a different collector in our ongoing effort to help you ensure that you’re using the best tools available.
Every monitoring system is born from a set of assumptions—assumptions that may ultimately impose functional limits on the system and what you can accomplish with it. This is perhaps the most important thing to understand about monitoring systems before you get started designing an infrastructure of your own: monitoring systems become more functional as they become less featureful.
Some systems make assumptions about how you want to collect data. Some of the very first monitoring systems, for example, assumed that everyone would always monitor everything using SNMP. Other systems make assumptions about what you want to do with the data once it’s collected—that you would never want to share it with other systems, or that you want to store it all in teensy databases on the local filesystem. Most monitoring systems present this dilemma, they each solve part of the monitoring problem very well, but wind up doing it in a way that saddles you with unwanted assumptions, like SNMP and thousands of teensy databases.
What if we could extract the good parts from each monitoring system—as if each were a bag of jellybeans from which we could keep the pieces we like? This line of reasoning implies a new way of thinking about the monitoring problem; instead of using a single monitoring system, we could combine a bunch of independent, special-purpose data collectors with a source-agnostic storage tier. This strategy would enable us to use whatever combination of collectors makes sense, and then store the monitoring data together, where it can be visualized, analyzed, correlated, alerted on, and even multiplexed to multiple destinations. If this sounds like a good strategy to you, then you’ll be happy to know that there are already tons of special-purpose open-source data collectors available.
To help get you started down the road of deciding on collection tools for your environment, we’re writing this post to document the patterns employed by the various data collection tools out there. With so many great tools to collect system and application metrics, it’s impossible to document them all, but no matter what tools you choose, they will probably employ at least one of the design patterns detailed herein.
Collector Patterns For System Metrics
We start by dividing interesting metrics into two general categories: those that are derived from within the monitored process at runtime, and those that are gathered from outside the monitored process. There are four patterns generally used by external processes to collect availability and performance data.
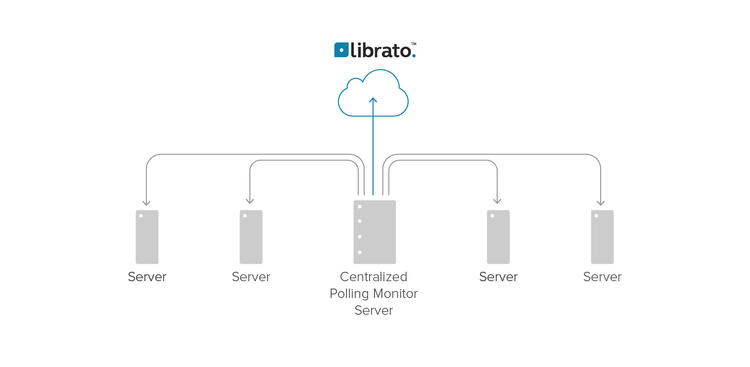
The Centralized Polling Pattern
Anyone who has been working with monitoring systems for a while has used centralized pollers. They are the archetype design; the one that comes to mind first when someone utters the phrase “monitoring system” (though, that is beginning to change). It looks like this:

How It Works
Like a grade-school teacher performing the morning roll call, the centralized poller is a monolithic program that is configured to periodically poll a number of remote systems, usually to ensure that they are available, but also to collect performance metrics. The poller is usually implemented as a single process on a single server, and usually attempts to make guarantees about the interval at which it polls each service (once every five minutes for example).
Because this design predates the notion of configuration management engines, centralized pollers are designed to minimize the amount of configuration required on the monitored hosts. They may rely on external connectivity tests, or they may remotely execute agent software on the hosts they poll, but in either case, their normal mode of operation is to periodically pull data directly from a population of monitored hosts.
Trade-offs and Gotchas
- Centralized pollers are easy to implement but often difficult to scale.
- Centralized pollers typically operate in “minute scale”, using for example, one or five minute polling intervals. This limits the resolution at which they can collect performance metrics.
- Older centralized pollers are likely to use agents with root-privileged shell access for scripting, communicate using insecure protocols, and have unwieldy (if any) failover options.
Examples of Pollers in the Wild
Although classical centralized pollers like Nagios, Munin, and Cacti are numerous, very few Librato-compatible collectors employ centralized polling directly. Most shops interject a metrics aggregator like Statsd between the polling system and the metrics storage system. The rearviewmirror collector for Nagios is one example of a pure direct poller, which can be run from cron, or scheduled by Nagios itself.
The Stand-Alone Agent Pattern
Stand-alone agents have grown in popularity as configuration-management engines have become more commonplace. They are often coupled with centralized pollers or rollup-model systems to meet the needs of the environment. They look like this:


How It Works
Agent software is installed and configured on every host that you want to monitor. Agents usually daemonize and run in the background, waking up on timed intervals to collect various performance and availability metrics. Because agents remain resident in memory and eschew the overhead of external connection setup and teardown for scheduling, they can collect metrics on the order of seconds or even microseconds. Some agents push status updates directly to external monitoring systems, and some maintain summary statistics which they present to pollers as-needed via a network socket.
Trade-offs and Gotchas
- Agent configuration is difficult to manage without a CME, because every configuration change must be pushed to all applicable monitored hosts.
- Although they are generally designed to be lightweight, they can introduce a non-trivial system load if incorrectly configured.
- Be careful with closed-source agent software, which can introduce backdoors and stability problems.
- Open source agents are generally preferred because their footprint, overhead, and security can be verified and tweaked if necessary.
Examples of agents in the Wild
Collectd is the most popular stand-alone agent with Librato support. Sensu uses a combination of the agent and polling pattern, interjecting a message queue between them. It is Librato-compatible via the Sensu Sender.
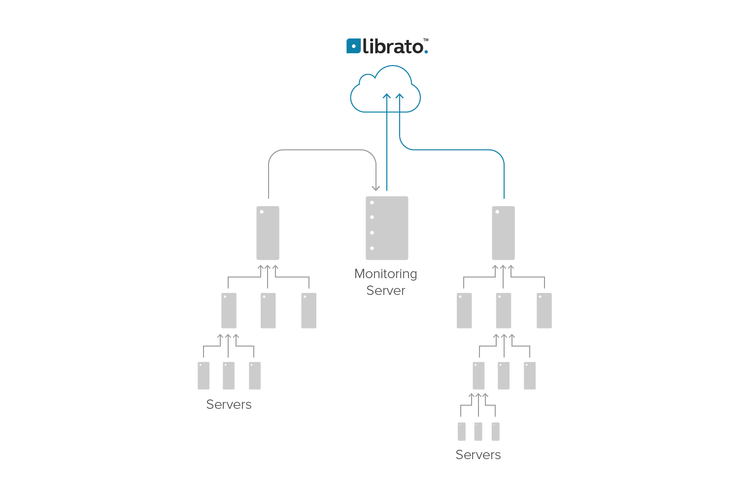
The Roll-up Pattern
The roll-up pattern is often used to achieve scale in monitoring distributed systems and large machine clusters or to aggregate common metrics across many different sources. It can be used in combination with agent software or instrumentation. It looks like this:

How It Works
The roll-up pattern is a strategy to scale the monitoring infrastructure linearly with respect to the number of monitored systems. This is usually accomplished by co-opting the monitored machines themselves to spread the monitoring workload throughout the network. Usually, small groups of machines use an election protocol to choose a proximate, regional, collection host, and send all of their monitoring data to it, though sometimes the configuration is hard-coded.
The elected host then summarizes and de-duplicates the data, and sends it up to another host elected from a larger region of summarizers. This host in turn summarizes and de-duplicates it and so forth.
Trade-offs and Gotchas
- Roll-up systems scale well, but can be difficult to understand and implement.
- Important stability and network-traffic considerations accompany the design of roll-up systems.
Roll-up in the Wild
Ganglia is a popular monitoring project that combines stand-alone agents with the roll-up pattern to monitor massive clusters of hosts with fine-grain resolution. The Statsd daemon process can be used to implement roll-up systems to hand-off in-process metrics.
Logs as Event-Streams
System and event logs are a handy event stream from which to derive metric data. Many large shops have intricate centralized log processing infrastructure from which they feed many different types of monitoring, analytics, event correlation, and security software. If you’re a Platform-as-a-Service (Paas) customer, the log stream may be your only means to emit, collect and inspect metric data from your application.
How it Works
Applications and Operating systems generate logs of important events by default. The first step in the log-stream pattern requires the installation or configuration of software on each monitored host that forwards all the logs off that host. Eventreporter for Windows or Rsyslogd on Unix are popular log forwarders. Many programming languages also have log generation and forwarding libraries, such as the popular Log4J java library. PaaS systems like Heroku have likely pre-configured the logging infrastructure for you.
Logs are generally forwarded to a central system like splunk, fluentd, or logstash for processing, indexing, and storage, but in larger environments they might be mapped, reduced, or processed by other fan-out style parallel processing engines. System logs are easily multiplexed to different destinations so there is a diverse collection of software available for processing logs for different purposes.
Trade-offs and Gotchas
- Although many modern syslog daemons support TCP, the syslog protocol was originally designed to use UDP in the transport layer, which can be unreliable at scale.
- Log data is usually emitted by the source in a timely fashion, but the intermediate processing systems can introduce some delivery latency.
- Log data must be parsed, which can be a computationally expensive endeavor. Additional infrastructure may be required to process logging event streams as volume grows.
Log Snarfing in the Wild
Our Heroku and AppHarbor add-ons make it trivial to extract metrics from your application logs, and there are several other tools on our collectors page for DIY log snarfing systems, like Logstash and Greylog.
Collection Patterns for In-Process Metrics
A radical departure from the patterns discussed thus far, instrumentation libraries enable developers to embed monitoring into their applications, making them constantly emit a stream of performance and availability data at runtime. This is not debugging code, but a legitimate part of the program; it is expected to remain resident in the application in production. Because the instrumentation resides within the process, it is monitoring that can gather statistics on things like thread count, memory buffer and cache sizes, and latency, which are difficult (in the absence of standard language support like JMX) for external processes to inspect.
Instrumentation libraries make it easy to record interesting measurements inside an application by including a wealth of instrumentation primitives like counters gauges and timers. Many also include complex primitives like histograms, and percentiles, which facilitate a superb degree of performance visibility at runtime.
The applications in question are usually transaction-oriented; they process and queue requests from end users or external peer processes to form larger distributed systems. It is critically important for such applications to communicate their performance metrics without interrupting, or otherwise introducing latency into their request cycle. Two patterns are normally employed to meet this need.
The Process Emitter Pattern
Process emitters attempt to immediately purge every metric via a non-blocking channel. They look like this:


How It Works
The developer imports a language-specific metrics library, and calls an instrumentation function like time() or increment(), as appropriate for each metric they wish to emit. The instrumentation library is effectively a process-level stand-alone agent, that takes the metric and flushes it to a non blocking channel (usually a UDP socket, or a log stream). From there the metric is picked up by a system that employs one or more of the external-process patterns.
Process Emitters in the Wild
Statsd is a popular and widely-used target for process emitters. The project maintains multiple language bindings to enable the developer to emit metrics from the application to a Statsd daemon process listening on a UDP socket.
The Process Reporter Pattern
Process reporters use a non-blocking dedicated thread to store their metrics in an in-memory buffer. They either provide a concurrent interface for external processes to poll this buffer, or periodically flush the buffer to upstream channels.


How It Works
The developer imports a language-specific metrics library, and calls an instrumentation function like time() or increment(), as appropriate for each metric they wish to emit. Rather than purging the metric immediately, process reporters hand the metric off to a dedicated, non-blocking thread that stores and sometimes processes summary statistics for each metric within the memory space of the monitored process. Process reporters can push their metrics on a timed interval to an external monitoring system or can export them on a known interface that can be polled on demand.
Process Reporters in the Wild
Process reporters are specific to the language in which they are implemented. Most popular languages have excellent metrics libraries that implement this pattern. Coda Hale Metrics for Java, Metriks for Ruby, and go-metrics are all in use at Librato.
Until Next Time
We hope this article will help you identify the assumptions and patterns employed by the data collectors you choose to implement in your environment. Be sure to check back, as we continue this series with in-depth analysis on the individual collectors that use these patterns in the wild.