Open-Source Technology and Monitoring
In software terms, “open source” means applications and their source code are available for the public to download and modify free of cost.
Anyone can access, edit, and supplement the code to create an enhanced version of the application. Vendors often do this by forking the source code to create their own version of the application, marketing their version commercially. These modified versions of open-source software typically have more features, better documentation, and dedicated customer support.
For an example of how well this can work, we need look no further than the Tor Browser. Popular for its increased privacy, it was originally based on the Mozilla Firefox source code, but it has since flourished with commercial support to boost services and performance.
When it comes to enterprise observability, here are some examples of open-source software organizations often implement to manage logs and metrics:
- Telegraf is a server agent driven by plug-ins and designed to serve as a central hub for the collection and sending of metrics to and from various sources, such as databases and internet of things (IoT) sensors.
- Fluentd is a plug-in included within Telegraf. It gathers metrics from a plug-in or HTTP endpoint and unifies the collected data for easier consumption. It features unified logging with JSON and has a pluggable architecture.
- Elasticsearch is a high-performance, open-source, RESTful, and distributed search and analytics engine built on Apache Lucene.
- The Intel Snap Telemetry Framework is meant to simplify the collection, processing, and publishing of system data via a single API.
Open-Source Technology for Monitoring
Though open-source software is a general concept, open-source monitoring involves using open-source software for IT infrastructure and application monitoring operations. These tools work hand in hand with the open-source observability tools mentioned before. Because they’re monitoring tools, they primarily collect metrics and counter values, as opposed to logs and other observability data. Some of the most popular open-source monitoring tools include the following:
- Prometheus, a Telegraf agent driven by plug-ins whose plug-ins are fully integrable into other systems. SolarWinds® AppOptics™ leverages the Prometheus plug-in. This plug-in collects time series metrics from HTTP servers and forwards them to AppOptics.
- Grafana is an observability tool combining metrics, logs, and traces into one dashboard.
- Nagios is an enterprise-ready monitoring solution for network monitoring, server monitoring, log monitoring, and application monitoring.
Limitations of Open-Source Monitoring Tools
Open-source monitoring tools always have a strong and passionate user base, but these tools also have drawbacks and limitations. These tools often come with technical debt community maintainers must address. When a bug fix is required or when a feature needs to be added or upgraded, it can take months of development and testing before a new version is released.
There’s no commercial support or service-level agreements (SLAs) for open-source monitoring tools. Without a guarantee of a timely fix or patch in the event of security vulnerabilities or critical errors, this can make them a risky option. Similarly, there’s no professional service available for installation, configuration, troubleshooting, and upgrades.
In the early stages, open-source projects are generally only intended for use by other developers. Some open-source monitoring tools only have a command-line interface or lack report generation features, limiting their suitability for seamless integration into corporate production use cases.
Many open-source monitoring tools can’t provide an end-to-end picture of the systems they monitor. Rather, they tend to focus on one area (such as network monitoring) instead of offering a holistic picture of the system. Clients will have to rely on many different open-source monitoring tools to cover all their bases.
Finally, open-source monitoring tools often lack integration with third-party alerting systems, service desk applications for automatic ticket generation, advanced analytical capabilities, and custom scripting language to query the data.
So where does this leave consumers looking for reliable and functional open-source monitoring tools?
Let’s think about the goals of monitoring applications. Monitoring the following metrics provides vital information about a system’s health:
- Average response times
- Error and request rates
- CPU usage
- Memory used
- Transactions completed per second
The better and more reliable the monitoring tools are—and the more metrics they can cover—the easier it is to identify the root cause of an issue.
Let’s consider two types of monitoring for IT systems: application performance monitoring (APM) and infrastructure monitoring.
Application Performance Monitoring

Application performance monitoring is primarily concerned with gathering information across the entire stack of a running system. According to Gartner, APM is “a suite of monitoring software comprising digital experience monitoring (DEM), application discovery, tracing and diagnostics, and purpose-built artificial intelligence for IT operations.” Learn more about what APM is in this blog post.
The main rationale behind APM is for enterprises to quickly identify the root cause of an error or degraded performance from multiple metrics, logs, and other feedback mechanisms. For businesses considering fault prevention and repair a priority, the chosen APM software needs to be reliable and comprehensive. And when one tool isn’t enough, integration and application compatibility should be widely available.
An APM solution can collect all the necessary metrics from a system and correlate them. It does so by monitoring the entire spectrum of the front-end UI, distributed services, middleware, databases, and the underlying infrastructure. It can also use logs from multiple sources as well as various availability tests.
Modern applications are distributed and complex in nature. Information flow through an application will have multiple touchpoints and transformations. As such, many factors can cause an error.
Once any of the collected metrics exceeds a set threshold, the APM solution alerts users. Modern APM interfaces display the collected data, allowing users to analyze it for the root cause.
Infrastructure Monitoring
Compared to APM tools, infrastructure monitoring tools focus on server-specific or network-related metrics such as CPU, memory consumption, disk I/O, network I/O, and more. Presently, many APM tools —such as SolarWinds AppOptics—also monitor infrastructure-level metrics.
So how can we achieve application and infrastructure monitoring with the flexibility of open-source solutions?
SolarWinds AppOptics
What Does AppOptics Offer?
SolarWinds AppOptics is a software as a solution (SaaS) product, and it’s part of a suite of tools called the APM Integrated Experience. It features a simple installation with minimum configuration and a whole lot of auto-instrumentation out of the box. AppOptics allows distributed tracing across application stacks, infrastructure monitoring with additional integrations, and custom metrics. All this information can be put together in easy-to-understand, out-of-the-box dashboards to help developers and operations teams. It also includes analytics capabilities and integration with common alerting mechanisms.
SolarWinds AppOptics builds upon the best features of open-source monitoring tools while providing the reliability and support of a commercial product. It also has plug-ins for many of the open-source tools out there—Fluentd, Telegraf plug-ins, and the Snap Telemetry Framework are all included to leverage these open-source integrations and ingest metrics from multiple source systems. The SolarWinds Snap agent is based on the Intel Snap Open-Telemetry Framework. Although AppOptics isn’t free like its open-source counterparts, it addresses many of the shortcomings associated with open-source monitoring tools. For instance, it comes with commercial support. Integrating AppOptics with modern IT systems is a lot easier because of its agent-based architecture, which doesn’t involve tweaking a myriad of configuration parameters.
AppOptics is part of an integrated platform called the APM Integrated Experience, bringing metrics, traces, logs, and user experience together. Whether you’re monitoring the server side (with infrastructure, microservices, monolithic applications, and databases) or the client side (with end-user synthetic monitoring and real user monitoring), the APM Integrated Experience provides comprehensive monitoring for developers, SREs, or those responsible for IT operations. Compared to open-source monitoring tools, everything needed for an overall health check is usually readily available in one or more key dashboards. With open-source monitoring tools, developers have to collate and relate the information across multiple information sources.
Report generation is also done automatically in AppOptics. All relevant metrics and traces are readily available in report form in just a few easy steps.
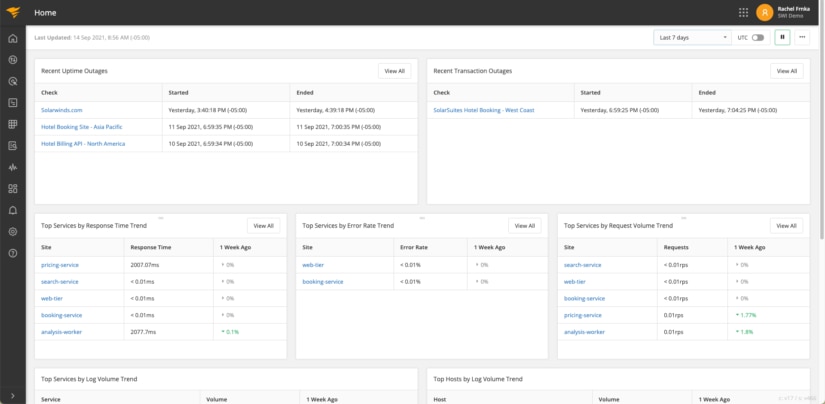
Shown below, the APM Integrated Experience homepage dashboard includes key service statuses for response time, error rates, and volume, all powered by AppOptics. It also calls log trends and volume for applications (powered by SolarWinds Loggly®) and provides insights into failed synthetic end-point and transaction tests (powered by SolarWinds Pingdom®).
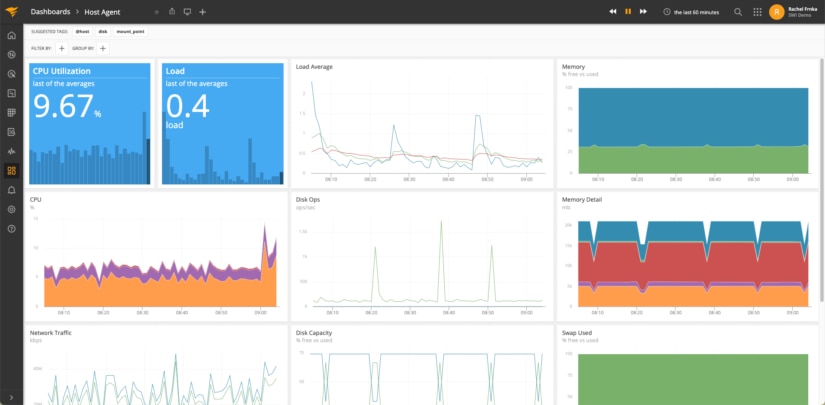
AppOptics provides multiple elements to make monitoring the infrastructure and associated services and applications easy.
- The services view can be displayed as a list or as a powerful services map not only showing you the status of each service but the relationship between them and the dependency a service has on other services, databases, etc.
- The host/container view, like the service view, can be in list format or represented by a visualization designed to make it easy to see which resources are approaching critical or are in a critical status. In both cases, AppOptics provides detailed drill-downs with a single click on either host or container.
- The plug-ins contain a list of active metrics and ones being used. As you continue to enable plug-ins, the list grows. As with just about everything in AppOptics, you can drill into each plug-in and understand what metrics are provided and which dashboards come out of the box.
- Alerting is a critical function for any APM solution, and the alerting in AppOptics makes it easy to create effective, proactive alerts, providing guidance on what metrics should be set up for alerting on potential system issues. The panel shows recently triggered alerts.
- Out-of-the-box and custom dashboards are displayed and can be cloned or modified with a few clicks. Many customers combine open systems metrics, AppOptics proprietary metrics, and business metrics together to provide insights beyond simple system status. The panel shows any custom dashboards created, and users can click on any dashboard link to open it.
How AppOptics Leverages Open Source
AppOptics takes the best features of open-source monitoring tools and packages them into a reliable and supported commercial product. In particular, AppOptics has over 37 open-source plug-in integrations and APIs. Here are some of the more prominent ones:
SolarWinds Snap Agent
Many monitoring tools are agent-based. This means a small application (the agent) installed on the target server collects metric data and sends it to the central monitoring server.
SolarWinds AppOptics has a “Snap Agent” based on the Intel Snap Telemetry Framework. This framework is open source and is meant to simplify the collection, processing, and publishing of system data via a single API.
The SolarWinds Snap Agent modular package consists of the following:
- SWIsnap: plug-in manager and task scheduler
- Plug-ins
- Collectors: gathers data operating on a defined time interval
- Streaming Collectors: gathers data to be forwarded only when it’s available
- Processors: processes data before sending it to publishers
- Publishers: forwards data to AppOptics
Telegraf
AppOptics is compatible with more than 100 Telegraf plug-ins. These plug-ins fall under numerous categories, such as logging, messaging, networking, and servers. Users can deploy each Telegraf plug-in as needed.
What AppOptics Brings to the Table
AppOptics, through its own proprietary architecture and the integration of open-source tools, has several benefits:
- Distributed transaction monitoring designed to help trace and analyze every application service request using numerous criteria, filters, and visualizations
- Code profiling to show the highest-used functions in a transaction. Code profiling provides the granular details of a transaction, going down to the specific line numbers of the code. This is useful for developers for troubleshooting or optimizing application code
- Auto-instrumented application and service topology map to show how services in a distributed application are dependent on each other. This is great for finding an application’s overall architecture and quickly tracing the root cause of an issue
- As part of the APM Integrated Experience, AppOptics seamlessly works with two other applications in the suite: Loggly and Pingdom
Loggly is a full-fledged log management and analytics solution with many advanced features, including source integration and dynamic field exploration. Pingdom is an invaluable solution for monitoring end points, user transactions, and end-user experience and satisfaction through both synthetic and real user monitoring.
Together with Loggly and Pingdom in the APM Integrated Experience, AppOptics offers an enhanced observability experience.
Conclusion
AppOptics can offer enhanced observability compared to open-source monitoring tools alone while still making good use of many open-source plug-ins and integrations. Taking the best aspects of open-source monitoring tools—and then adding improved functionality and reliability—AppOptics presents an easy-to-use and comprehensive platform.
AppOptics allows users to have complete end-to-end visibility through a single pane of glass to pre-empt, trace, and solve application issues. To see how it all works, sign up for a 30-day free trial now!