Many teams take advantage of the convenience of deploying their apps to the platform as a service (PaaS) providers such as DigitalOcean. Cloud solutions like this are an easy way for teams to deploy and scale their applications without worrying about the details.
However, even in these managed environments, poorly written apps can cause issues. If your pages load too slowly, users will likely leave your site and look for another. Google also uses load time in its ranking algorithm, so a slow site can prevent users from even landing on these slow pages in the first place.
Errors create an even worse user experience. Users want to be sure an application will do what they expect and won’t lose their data or expose it to the public. And despite the best QA efforts, some bugs still get through.
Once your application’s in production, you need real-time monitoring to identify issues and fix them before users jump ship. Application performance monitoring tools like SolarWinds® AppOptics™ work together with the simplicity and power of DigitalOcean to give you a unified dashboard to monitor all your applications from one place.
In this article, we’ll look at how easy it is to add AppOptics to a Node.js app deployed on DigitalOcean and how you can use AppOptics to monitor and fix application issues.
What You Need to Get Started
To follow this tutorial, you’ll need the following:
- A DigitalOcean account to deploy your application. The cheapest option is fine for this demo.
- A SolarWinds account for access to AppOptics.
- Docker installed on your computer if you want to run the project locally.
The AppOptics Node.js module requires Linux, so using Docker locally makes it possible for anyone to run the project.
What You’ll Deploy
For our example, I’ll use a simple Express App. In this case, it’ll be a poorly written app designed to run slow and throw errors so you can see how to use the AppOptics dashboard to diagnose and fix them.
You can fork my finished project here or start from scratch by following these steps:
- Create a project folder and navigate to it via command line.
- Run npm init and follow its process to create an npm project.
- Run git init so you have a git project you can push to GitHub, Bitbucket, or your preferred git provider.
- Run npm install express dotenv.
- Create an .env file in your project and ignore it in git.
- Create an index.js file and leave it empty for now.
- Create a Dockerfile like this one to run the project locally.
- Create a docker-compose.yml file like this one so you can run the project locally with one command.
Adding AppOptics to a Node.js App
First, let’s look at how easy it is to add a service we want to monitor to AppOptics. Log in to AppOptics, go to the “Services” dashboard, and click the “Add Service” button.
AppOptics Services Dashboard
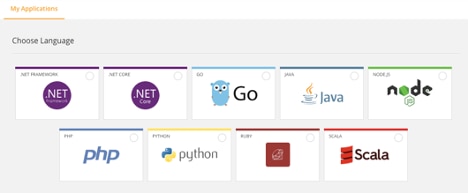
Next, choose the language for your application. We’ll choose Node.js.
AppOptics SDK Languages
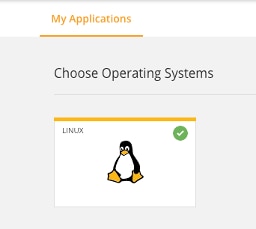
Next, choose the operating system (Linux is the only option for the Node.js package).
AppOptics Operating Systems
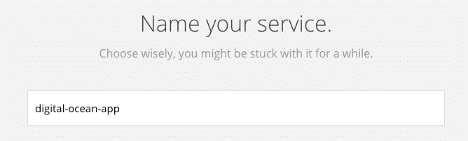
Give your application a name.
AppOptics Service Name
And finally, you’ll see the instructions for adding AppOptics to your application.
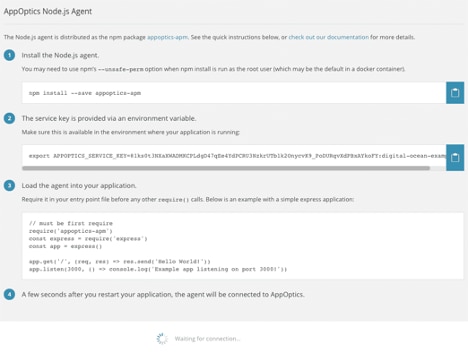
AppOptics Package Installation
Notice the “Waiting for connection” message at the bottom of the page. Once you go through the installation steps, it’ll disappear and the “Done” button at the bottom will become clickable.
To run the project locally, you’ll need a Linux computer to follow these installation steps. If you’re starting from scratch rather than forking my repo, add this line to the dependencies in your package.json file:
“appoptics-apm“: “^8.1.0”,
For the second step, you’re going to use dotenv and an .env file on DigitalOcean to read this environment variable. Locally, you’ll just have an entry in the docker-compose.yml file to read from the .env file. Open the .env file you created and add your APPOPTICS_SERVICE_KEY like this:
APPOPTICS_SERVICE_KEY=bunchofrandomlettersandnumbers:project-name
Then, copy the code in step three of the installation instructions and paste it into the index.js file you created in your project (since we’re only creating a test app). If you were adding AppOptics to an existing application, you’d simply need the appoptics-apm package. Now run docker-compose up to launch your project locally.
Once your project’s running, the AppOptics wizard will detect the connection. Then, you can click “done” to see your new service in the dashboard. Alternatively, you can wait until you deploy the app to DigitalOcean to see this message disappear.
AppOptics New Service
Let’s Make a Slow, Buggy App
We just created the definition of a “Hello World” app. It’s pretty boring, though. We want to see some errors and some slow pages, so let’s make some. Open the index.js file and change it so it looks like the following:
require(‘appoptics-apm‘)
const express = require(‘express’)
const app = express()
app.get(‘/’, (req, res) => {
setTimeout(() => res.send(‘Hello World!’), 5000)
})
app.get(‘/reference’, function (req, res) {
res.send(message)
})
app.get(‘/range’, function (req, res) {
const arr = [90,88]
arr.length=90**99
res.send(‘Did It Work?’)
})
app.get(‘/type’, function (req, res) {
const num = 123
num.toUpperCase()
res.send(‘Did It Work?’)
})
app.get(‘/uri‘, function (req, res) {
decodeURI(“%”)
res.send(‘Did It Work?’)
})
app.get(‘/custom’, function (req, res) {
throw new Error(‘Something went wrong’)
})
app.get(‘/not-found’, function (req, res) {
res.status(404).send({
status: 404,
error: ‘Not found’
})
})
app.listen(3000, () => console.log(‘App listening on port 3000!’))
Here are all the problems we’ve coded into our app:
- The home page will take five seconds to load.
- The /reference route will throw a JavaScript Reference error.
- The /range route will throw a JavaScript Range error.
- The /type route will throw a JavaScript Type error.
- The /uri route will throw a JavaScript URI error.
- The /custom route will throw a custom generic JavaScript error.
- The /not-found route will return a 404 error.
Commit your changes and push them up to your git repo.
Deploying to DigitalOcean
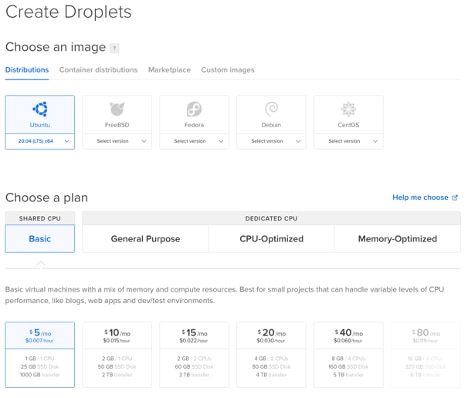
Deploy the app to DigitalOcean so you can generate some stats in the AppOptics dashboard. You can deploy the app using the DigitalOcean New App Platform, but for this tutorial, we’ll do a manual deployment. Deploying an app, even manually, to DigitalOcean is easy. Log in to DigitalOcean and create a new Droplet for your application. Choose Ubuntu as the operating system and the smallest instance.
Digital Ocean Droplet
You can leave the region and all other settings as they appear. Scroll down to the “Authentication” section and either set a password for your server or add an SSH key by clicking the “New SSH Key” button and following the steps for your operating system.

Digital Ocean Droplet Authentication
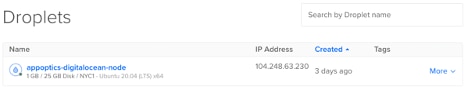
Finally, click “Create Droplet” at the bottom of the page. That’s it! You should now see your new Droplet.
New Digital Ocean Droplet
Log in to this Droplet from the command line as root.
ssh root@IP_ADDRESS_FROM_DROPLET_DASHBOARD
Clone either the repo you created or mine.
git clone https://github.com/eristoddle/appoptics-digitalocean-node
Change to this directory and install the dependencies.
cd appoptics–digitalocean-node
apt install npm -y
npm install
Create an .env file with the key for AppOptics.
echo APPOPTICS_SERVICE_KEY=”bunchofrandomlettersandnumbers:digital-ocean-example” > .env
Start the application with the following command:
node -r dotenv/config index.js
You should now be able to navigate to the Droplet’s IP address in the browser with a port number of 3000 to see the live app.

Hello World App
Monitoring Your App in the AppOptics Dashboard
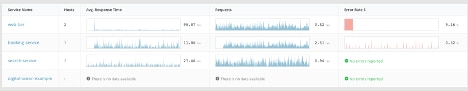
Navigate to the AppOptics dashboard for your new app. You’ll see the agent we’ve installed is returning three types of data: average response time, request rate, and error rate. Notice the Average CPU Utilization card has an install button. This is because Average CPU Utilization is not an application-level agent, so you still need to install it on the server.

Install Host Agent Button
Click the button and you’ll be taken to another wizard to choose your operating system. Select Ubuntu and you’ll see instructions. Stop your app in the terminal and run the install command.

Install AppOptics Host Agent
Start the server again:
node -r dotenv/config index.js
Next, hit your routes several times to see the results in AppOptics. I opened all the routes in a browser and set each to auto-refresh for several hours to get this:
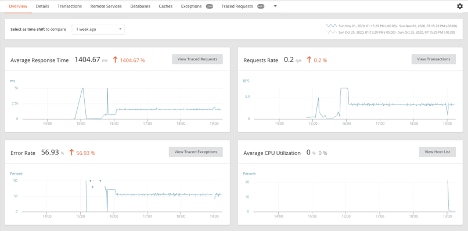
AppOptics Results
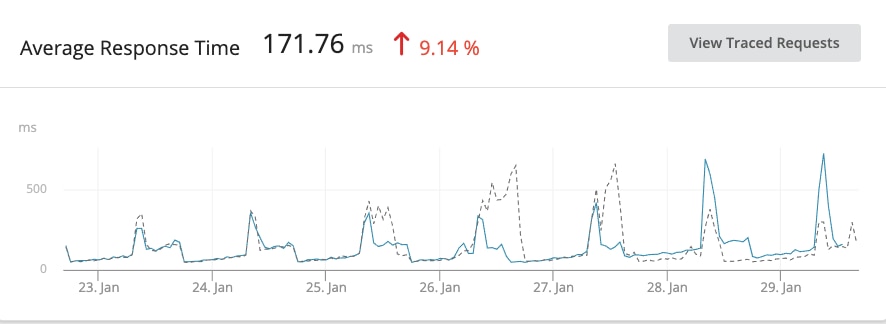
If you click “View Traced Requests,” you can track the slow-running page. You can see our home page takes a little over five seconds to load.

AppOptics Response Time
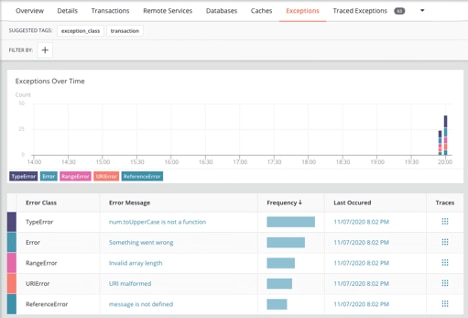
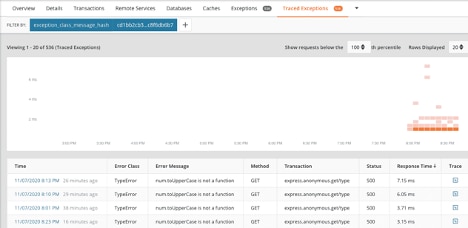
By clicking on “View Traced Exceptions” in the dashboard or “Traced Exceptions” in the top navigation bar, you’ll see the pages with errors—and we’ve generated a lot of errors. You should see five of the errors you added to the app. Clicking on the header of the table will allow you to sort by this data point.

AppOptics Traced Exceptions
Clicking on the Trace image at the end of a row will take you to more details on a specific error, including a stack trace to help you track down exactly where the error occurs in the code. If you click on the “Trace” button for the generic error, you’ll see something similar to the image below.
In this view, we see the “Something went wrong” error occurs on line 30 of the script. If this was a production bug you weren’t able to recreate, you would know where to start troubleshooting.

AppOptics Stack Trace
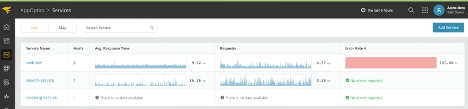
By clicking on the “Exceptions” tab of the “Services” dashboard, you’ll see a different view of the errors broken down by error type.
AppOptics Service Exceptions
Clicking on the “Trace” button at the end of the row here will take you back to Traced Exceptions, which is now filtered by this specific exception. This isn’t very useful in your app, since you know these errors are coming from the same place. However, if it were a custom error coming from a specific package you’re using, it’ll give you an indication of how much it’s affecting your app.
AppOptics Filtered Exceptions
The “Details” tab of the “Services” dashboard gives you a more comprehensive overview of the health of your application, including Top Transactions, Top Hosts, HTTP Status Codes, and HTTP Methods along with the other data you’d find in the “Overview” tab.

AppOptics Details
The “Transactions” tab displays a breakdown of the endpoints of the app. You can see the home page is consistently slow. The average response time is over five seconds. The five endpoints also consistently have errors. The “not found” page doesn’t actually throw an exception; it just returns a 404 status.
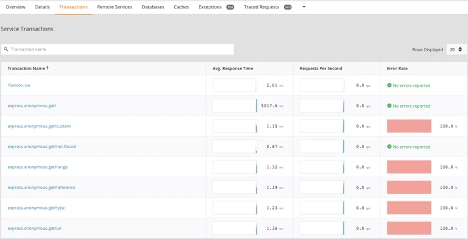
Click on the transaction name to drill down into this information.

AppOptics Transaction Details
Since the application we created doesn’t connect to remote services or use a database or cache, we don’t have examples for this. The “Remote Services” tab allows you to trace remote service calls and helps you find ones running slow or returning errors. The “Databases” tab helps you track down slow database queries, and the “Caches” tab gives you performance statistics on your caches.
There are many more ways to slice and dice the performance data you get back from your buggy app. Click around and see what else you can find.
Conclusion
Technology has come a long way since you had to deploy to on-premises servers and manually search through log files to debug problems. PaaS solutions like DigitalOcean now make it easy to deploy and scale apps. Additionally, monitoring tools like SolarWinds AppOptics “plug in” to DigitalOcean and make it easy to track down latency and errors capable of driving away users. Together, DigitalOcean and AppOptics give development teams a combination allowing them to easily deploy and monitor their apps. Try AppOptics for free for 30 days.