
 Note: This article was originally published on Librato, which has since been merged with SolarWinds®AppOptics™. Learn how you can monitor Django app performance with AppOptics.
A few weeks ago, we shipped the Librato integration for Ruby on Rails. Today, we are pleased to announce beta support for Django, one of Python’s most popular web frameworks. You can now monitor your Django web application’s health and performance in a matter of minutes, with zero modifications to your application code.
If you are new to Librato, check out our instructions on getting started. Otherwise, sign in to your Librato account, create a Django integration, and follow the simple instructions to install our binding agent and configure and (re)launch your web application. Within a few minutes, you’ll begin to see metrics in your new curated Django dashboard.

Features
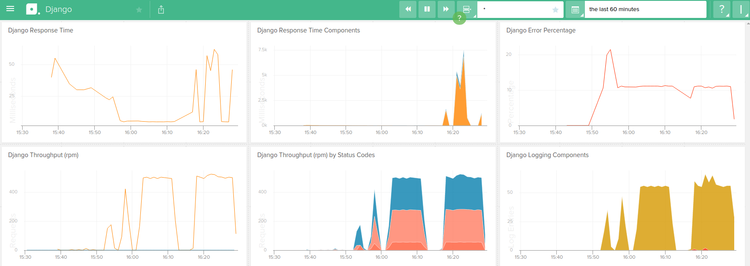
Our instrumentation reports above 80 metrics that measure various performance and health metrics. It is easy to fine-tune the reported metrics using the provided configuration file.
- Current and historical average web response times, including visibility into model layer latency, WSGI application layer overhead, time spent accessing external services, and in the application code itself.
- Overall throughput, broken down by HTTP status codes.
- Error request percentages.
- Log volume for critical, error and warning messages, achieved by instrumenting the standard logging module. A variation in the log volume can often signal anomalous behavior.
System requirements
You’ll need a recent stable version of Django running Python 2.7. Our instrumentation was most recently tested using Django 1.8.6, Python 2.7.3 and Ubuntu 14.04.3 LTS.
How It Works
Our instrumentation is designed to work with no code modifications to your application.
- Installing our pip package gives you the ability to transparently wrap the appropriate Django and Python classes and report useful measurements to Librato. However, the instrumentation doesn’t kick in unless you run it using the launcher utility (see below).
- Running your application using our launcher utility enables the instrumentation, which ultimately reports the metrics for the app.
- The launcher also spins up a bundled StatsD process, which aggregates and reports measurements to Librato.
- Metrics are reported to Librato asynchronously, in order to reduce the performance impact on executing web requests.
- Optionally, you can create a Python virtual environment to isolate the instrumentation to your Django web application.
You can optionally create a Python virtual environment to isolate the instrumentation to your Django web application.
More Information
Check out our Knowledge Base article for step-by-step details on configuring and running Django web applications. If you’d like to contribute features or bug fixes, please create a pull request on the librato-python-web GitHub project.