
Decoupled service teams iterating independently in delivery of microservices move in production of new services and new versions of those services. As such, it’s commonplace to have hundreds of containers and services running many different languages and frameworks. Unfortunately, container orchestrators are mired with so many layer 1 through layer 4 concerns, that they leave the needs of higher layers underserved.
Service Mesh in a Nutshell
Gaining insight and control over their service-to-service communication is a non-trivial problem. Conceptually operating at layer 5, service meshes offer a major advantage in providing a holistic framework to enhance observability, security, and control of your application flows without having to change any application code. They are also described as decoupling of developers and operators from their interdependence in affecting service behavior.
In November 2018, AWS released the public preview of App Mesh to enable customers to move into this third phase of their cloud-native journey. Today, we are happy to announce SolarWinds® AppOptics™ support of this managed service mesh!
App Mesh in a Nutshell
Within the service mesh landscape, App Mesh, like other service meshes, deploys and configures a proxy that manages all communications traffic to and from your containers, removing the need to configure communication protocols for each microservice, write custom code, or implement libraries to operate your application. You can use App Mesh with existing or new microservices running on AWS Fargate, Amazon ECS, Amazon EKS, and self-managed Kubernetes on AWS.
App Mesh is built on Envoy, a CNCF-hosted project that is gaining popularity as both a load balancer and a proxy, useful at the edge and inter-service. App Mesh utilizes Envoy to handle routing decisions based on App Mesh configuration, while simultaneously exposing many metrics without additional setup. AppOptics supports the collection of similar metrics from other service meshes. In the case of Istio, the SolarWinds Adapter for Istio supports both collection of metrics and logs, offering your choice of integration of AppOptics, Papertrail™, and Loggly®—or all three!
Service meshes commonly, and App Mesh specifically, generate service-level metrics such as request count, request latency, active connections, and resource utilization. And that’s where AppOptics comes into the picture, by allowing you to create dashboards to visualize these metrics and alerts to track them. Internally, we’ve already been using the Envoy StatsSink configuration options to push our own Envoy metrics into AppOptics as shown:
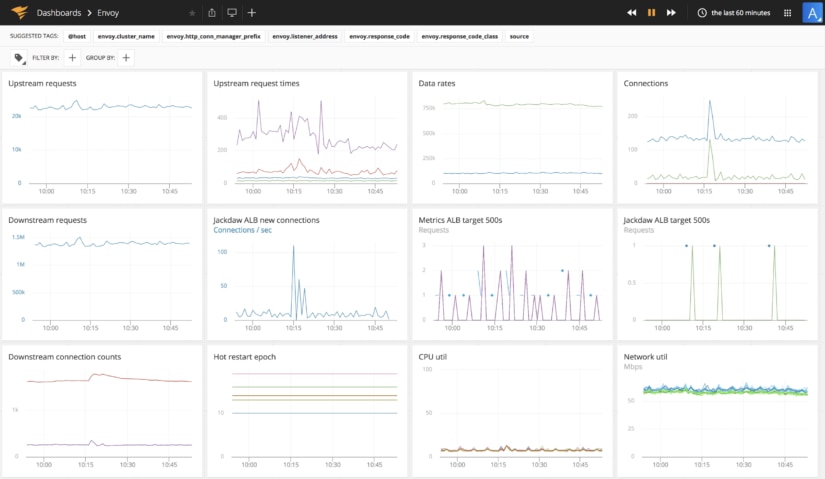
AppOptics does this by running the SolarWinds Agent Docker image as a sidecar container in your App Mesh deployment and reporting all of the Envoy metrics to AppOptics. Configuring Envoy to send metrics to the agent’s statsd plugin is just a few lines of configuration opening up the possibilities of metrics like the dashboard above.
A simple configuration can consist of two small bits of YAML. The first, which belongs in the Envoy bootstrap config, will look something like this:
stats_sinks:
    - config:
        address:
          socket_address:
            address: 127.0.0.1
            port_value: 8126
            protocol: UDP
      name: envoy.dog_statsd
Since the AppOptics agent runs as a sidecar, Envoy can use the shared network to send its metrics to the local port on which AppOptics is listening. Your AppOptics agent configuration will be detailed in the statsd plugin configuration. A sample configuration, assuming the above settings in Envoy, could look like this:
collector:
      statsd:
        all:
          protocol: "udp"
          service_address: ":8126"
          metric_separator: "."
          parse_data_dog_tags: true
          bridge_prefix: ""
          grpc_timeout: 30
          bridge_use_json_fields: false
    load:
      plugin: snap-plugin-collector-bridge-statsd
      task: task-bridge-statsd.yaml
Using this configuration, Envoy metrics can be easily pushed to AppOptics. With our prior announced support of EKS cluster metrics, AppOptics gives you an opportunity to use the AppOptics agent sidecar for application, host, and Kubernetes metrics. All of these integrations provide a real opportunity to conquer the challenge of monitoring a distributed multi-node, multi-service Kubernetes deployment by unifying everything into one place.