If you’re already using or planning to use AWS Lambda to run code without provisioning or managing servers, you’ll want to monitor your serverless applications with the new SolarWinds® AppOptics™ Lambda forwarder and APM agents.
If you’re not using AWS Lambda, here’s what you need to know—it’s an event-driven, serverless computing platform by Amazon Web Services. About 20% of global companies are already using serverless offerings such as Lambda, and this usage is expected to grow to 50% in the next five years.

But how exactly does the Lambda forwarder work?
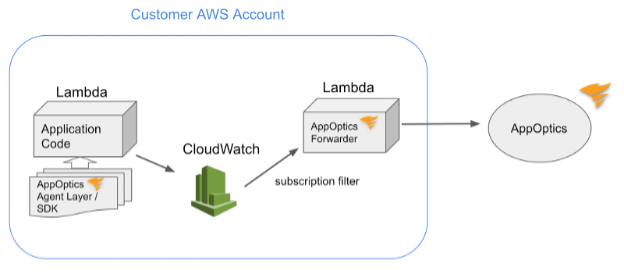
The AppOptics Lambda forwarder is a serverless application repository you can install as a Lambda function in your AWS account. It is then invoked by the CloudWatch Logs subscription filter(s) you configure on the log group of your Lambda function. The forwarder reads these logs events to report enhanced metrics. And if you’ve enabled tracing on your function, the forwarder can also report the trace data in your log events to AppOptics.
We’ll go into more detail about enhanced metrics in a moment, but first let’s answer your next question.
Why would I want to use distributed tracing?
Tracing can provide valuable insight if you’re trying to figure out what’s causing your Lambda function to execute slowly or if you need to find out the cause of errors or failed invocations of those functions.
What kinds of enhanced metrics can I expect?
The AppOptics Lambda forwarder can provide the following enhanced metrics:
- The Lambda function invocation’s duration (in milliseconds)
- The Lambda function invocation’s billed duration (in milliseconds)
- The time taken to initialize the Lambda function execution environment for a cold start invocation (in milliseconds)
- The memory used by the Lambda function (in megabytes)
- The memory configured for the function (in megabytes)
You’ll also be able to use tags such as @host to see host aliases and the @host tag or environment.
How do I get started?
We thought you’d never ask! To get started:
- First, set up the AWS CloudWatch Integration to pull Lambda metrics.
- Next, check out the AppOptics technical documentation and use our script to help set up the forwarder and subscription filter(s).
- Then, set up the AppOptics Lambda forwarder by downloading the installation script we provide and run it in the interactive mode.
- Last, configure your Lambda function’s log group using the subscription filter. Instructions on how to do this are also included in the AppOptics technical documentation.
Now you’ll be able to use AppOptics Lambda forwarder and APM agents to get enhanced metrics for your Lambda function. And as we talked about earlier, you’ll want to get tracing data too, so be sure to enable it on your AWS Lambda function.
Note: You may see additional costs in your AWS account when you enable the forwarder and APM agents, but you’re likely still saving significantly by taking advantage of the flexibility and automatic scaling of the serverless environment.
If you aren’t already using AppOptics, sign up for a full-featured 30-day trial and see the benefits for yourself with no commitment.
Like what you see? Come join our SolarWinds community on THWACK® and get the inside scoop on all things AppOptics!


