Managing servers isn’t always the most effective way to run an application. With serverless computing, teams can deploy applications directly to managed hardware, scale them on demand, and avoid the overhead of provisioning and maintaining their own infrastructure. As many as 40% of companies surveyed by DevOps.com use serverless computing. And serverless platforms like Azure Functions make deploying serverless questions quick and easy.
However, despite being fully managed, Functions still requires oversight. Applications deployed to Functions are still susceptible to slow response times, failed requests, crashes, and other conditions. Just because the platform is managed by Microsoft doesn’t mean your applications will always work flawlessly.
Monitoring your Functions fills this gap an, allowing you to detect these conditions when they arise. With SolarWinds® AppOptics™, you can fully monitor your applications running on Azure Functions by collecting metrics, running traces, and identifying errors as they happen. In this post, we’ll show you how AppOptics Azure integration works and how easy it is to get started.

What to Monitor in Azure Functions?
It’s easy to think just because Azure Functions abstracts away the underlying infrastructure, you no longer need to focus on infrastructure metrics. However, monitoring these metrics arguably becomes more important as they give you direct insight into how your application is performing. For example:
- Request rate indicates how many requests your application can serve at a time.
- Connections and threads measure how many open network connections your application can manage at once.
- Network throughput measures how much bandwidth your application uses, which is useful for both billing and data transmission purposes.
- Resource (e.g., CPU and RAM) usage tracks how much computing power your application needs, which is useful for measuring efficiency and billing costs.
- HTTP errors indicates how many errors your application generates.
- Garbage collection runs indicates how well your application manages memory.
Another important metrics is executions, or the number of times your application is executed in response to an event, such as an incoming HTTP call. Total executions make up part of the Azure Functions billing model, in addition to the total amount of time your application spends running. Staying on top of these metrics can save you from an unexpectedly high bill.
How Does AppOptics Help?
SolarWinds AppOptics is an application performance monitoring (APM) and infrastructure monitoring solution that integrates with Azure and collects platform-wide metrics, including:
- Bandwidth
- Memory usage
- Function executions
- I/O
- Garbage collection runs
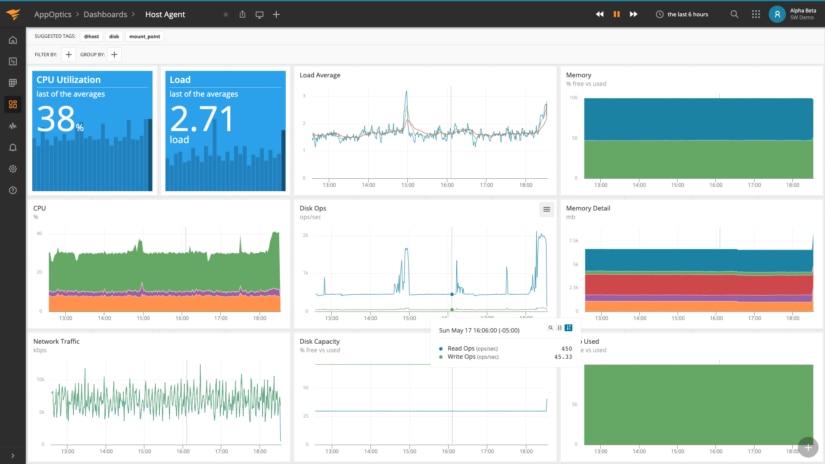
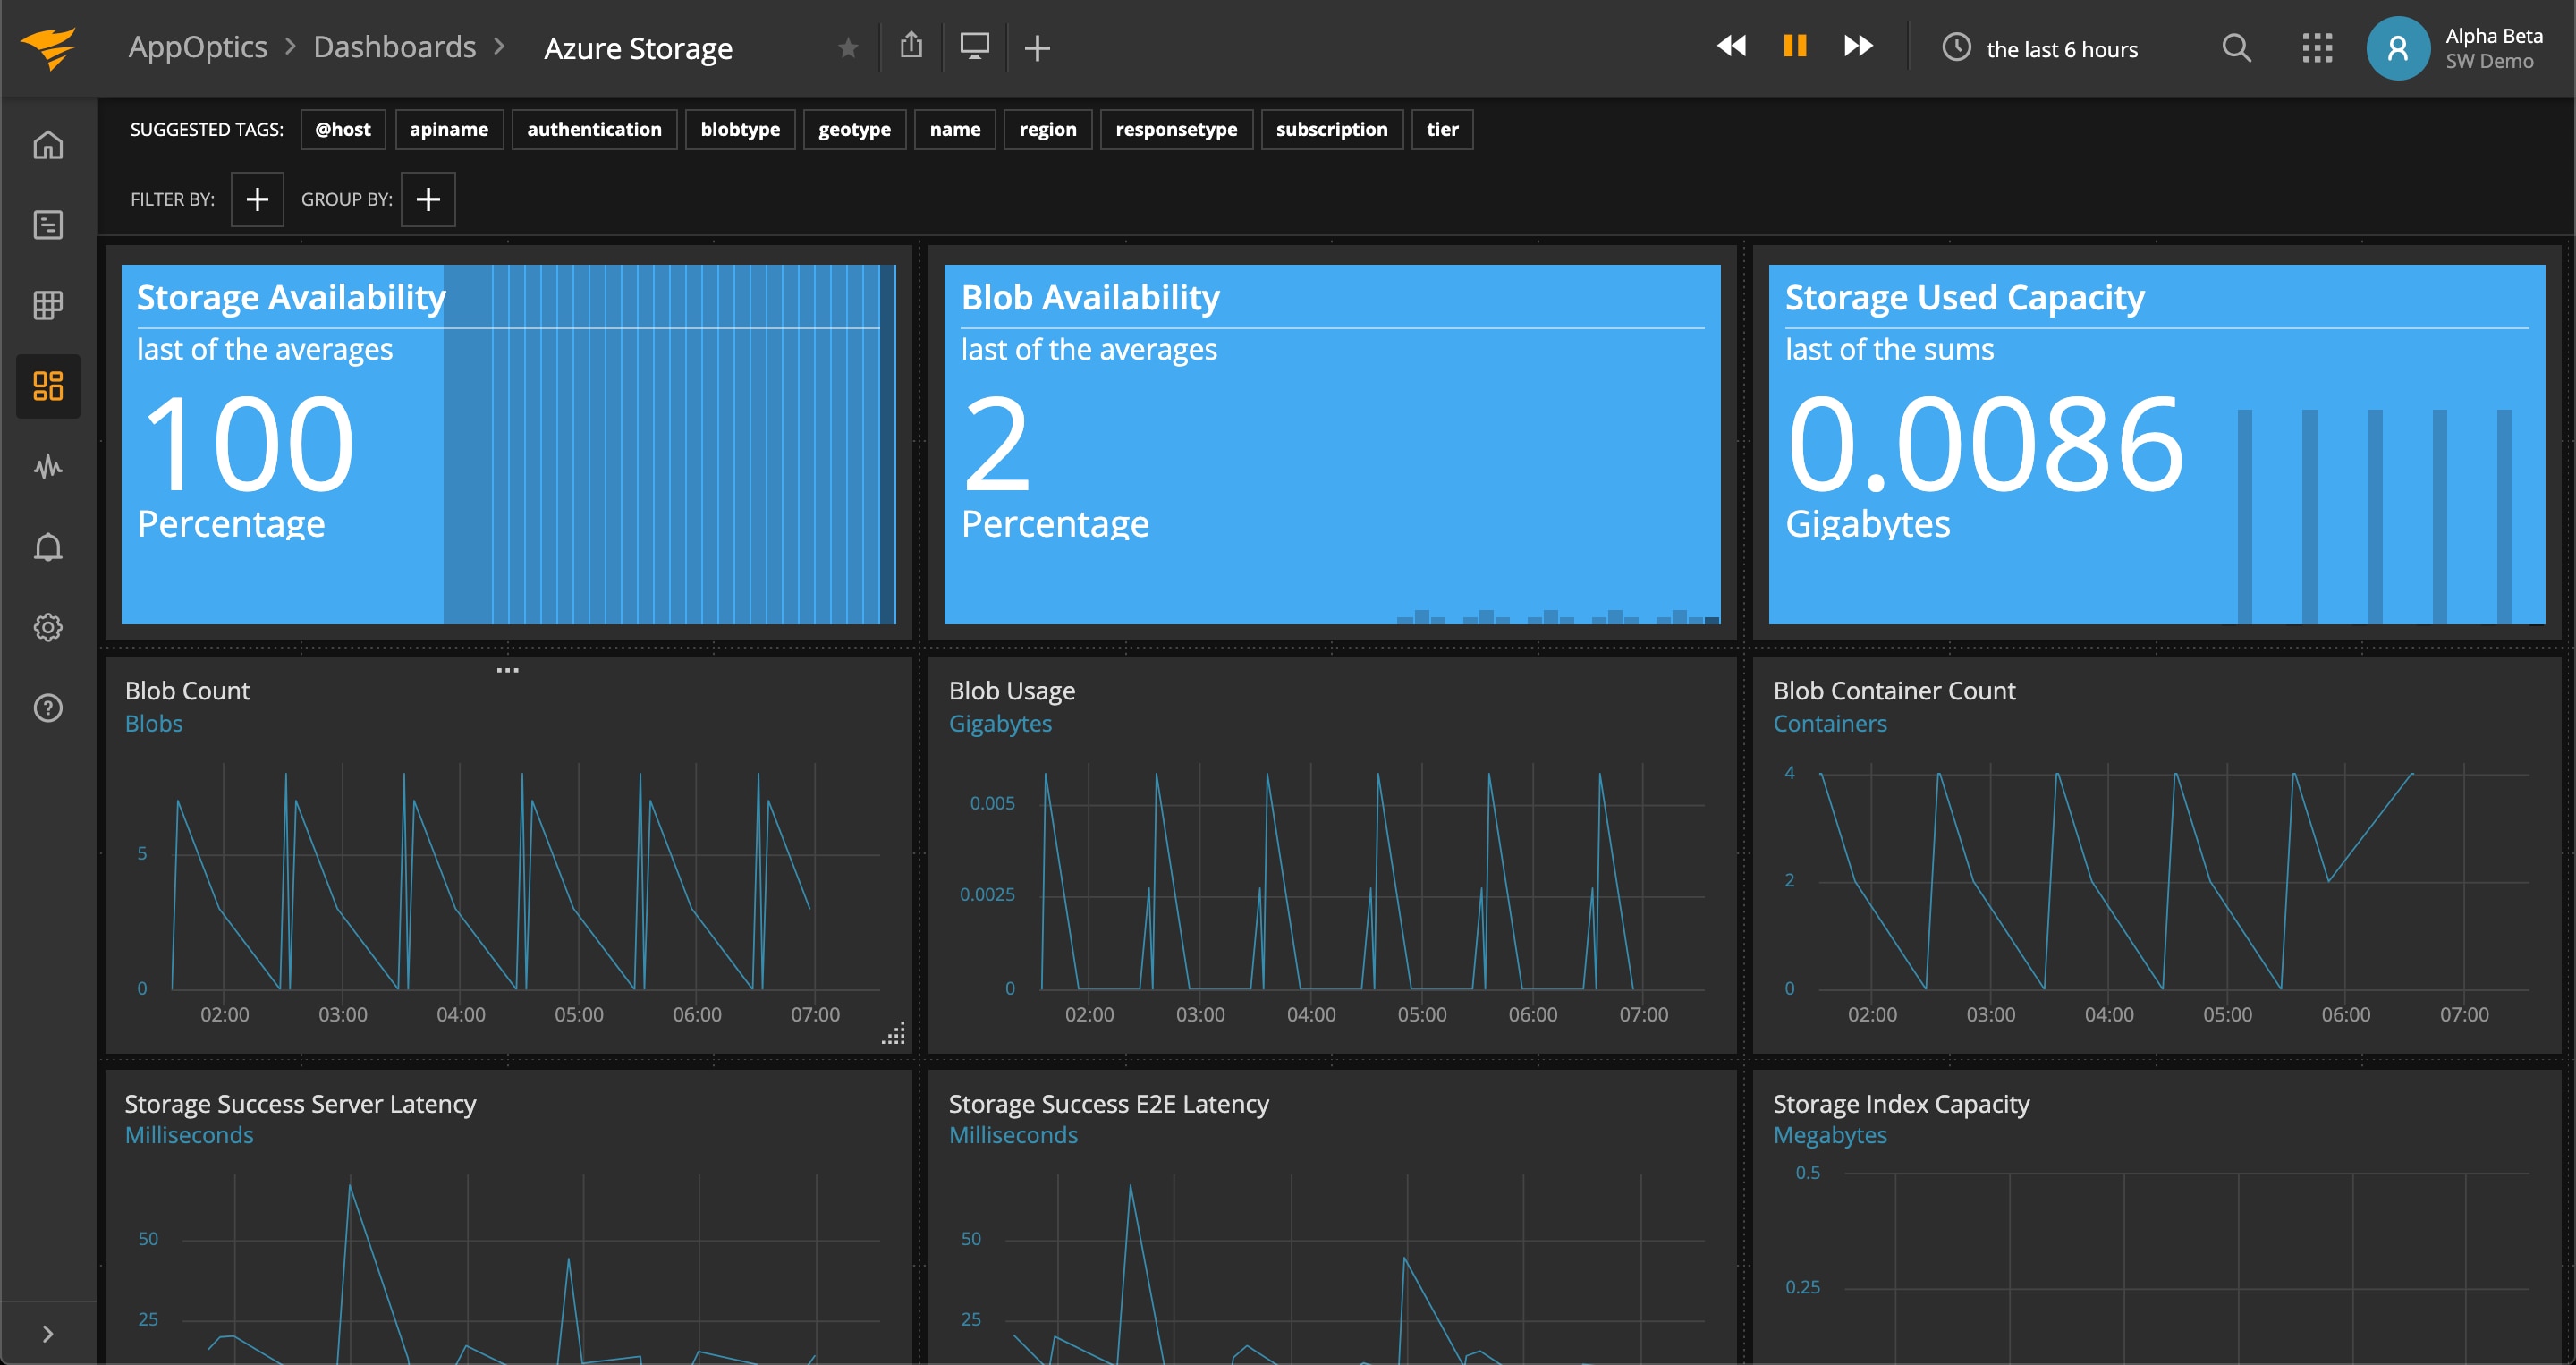
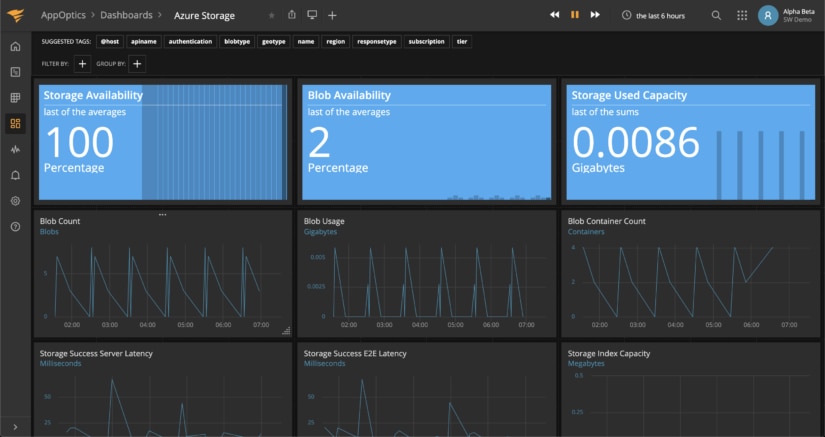
With AppOptics, you can view real-time and historical metrics from across the Azure platform, including Azure Functions applications. Your metrics are consolidated into a single easy-to-use interface where you can view dashboards, perform trend analyses, and dive deep to troubleshoot problems.
Integrating Azure Functions with AppOptics is as easy as enabling Azure Monitor integration in your AppOptics account. As soon as you deploy your application, AppOptics automatically begins collecting and displaying metrics. You can use these to:
Monitor function performance. Several factors can influence function performance, including:
- Computing resources allocated to each function instance
- Cold starts (waiting for Azure to start a new instance of your application)
- Code optimization
- Additional network requests or requests to other services
With AppOptics, you can easily track the root cause of performance problems by analyzing key performance indicators such as throughput and resource consumption.
Set alerts for errors or downtime. If your app crashes or becomes unresponsive, your teams need to know immediately. Alerting is a cornerstone of APM and infrastructure monitoring and is especially useful for serverless platforms like Azure Functions. AppOptics lets you create actionable alerts using highly granular conditions to reduce your signal-to-noise ratio and find out what you need to know quickly.
Track logs with SolarWinds Loggly® or SolarWinds Papertrail™. Metrics and traces are only two of the three pillars of observability. Logs provide the detailed messages and contextual data necessary to dig deep into issues and find the root cause. AppOptics integrates with SolarWinds Loggly and SolarWinds Papertrail to link you to related logs quickly.
Conclusion
Azure Functions greatly simplifies how we run applications. Just because it’s serverless doesn’t mean you can’t access insightful metrics and traces across your infrastructure. SolarWinds AppOptics lets you oversee and manage your serverless applications and other workloads from a single interface to better understand what’s happening across your infrastructure. To give it a try, sign up for a free 30-day trial.