
What Is It, and Why Did We Build It?
The new SolarWinds® AppOptics™ integration enables you to view the health and performance of Azure services such as Load Balancers, Cosmos DB, Redis, Functions, and Azure Virtual Machines, alongside existing application and infrastructure metrics. Once the integration is set up, AppOptics will automatically pull metric data from the different Azure services and provide preconfigured dashboards to make the information easy to understand.
How Can This Integration Help Me?
Without the right visibility, Azure services can cause bottlenecks that are difficult to diagnose. Let’s look at Cosmos DB as an example. When too many requests are sent to Cosmos DB and the provisioned throughput for a collection is exhausted, Cosmos DB will start responding with a HTTP 429 status, meaning requests are being rate limited. The 429 status tells your application to wait a little while, and then try again. Eventually this loop will return an error if it’s constantly rate limited.
Imagine troubleshooting this issue without an APM tool. The application would get slower and slower as more requests are rate limited, and eventually start throwing exceptions. Using AppOptics paired with the new Azure integration, you can view Cosmos DB throughput, by collection, alongside the request volume and status codes. You can even set up proactive alerts that fire as you approach your throughput limits.
This same level of visibility and proactive alerting is available for all the Azure services supported in AppOptics.

Azure Monitoring Made Easy
Getting Azure service data into AppOptics couldn’t be easier. Unlike other Azure monitoring solutions, AppOptics doesn’t require you to set up complex security roles or go through an app registration process; instead, you simply enter your Azure username and password into our simple Azure setup wizard, and tick the boxes of whatever services you want to pull metrics from. That’s it. If you can log in to a website using Google, you can setup the Azure integration.
What’s Supported?
AppOptics supports the following Azure services:
- App Service
- Cosmos DB
- SQL Databases
- Redis
- Functions
- Storage
- Key Vaults
- Virtual Machines
Azure App Service Support
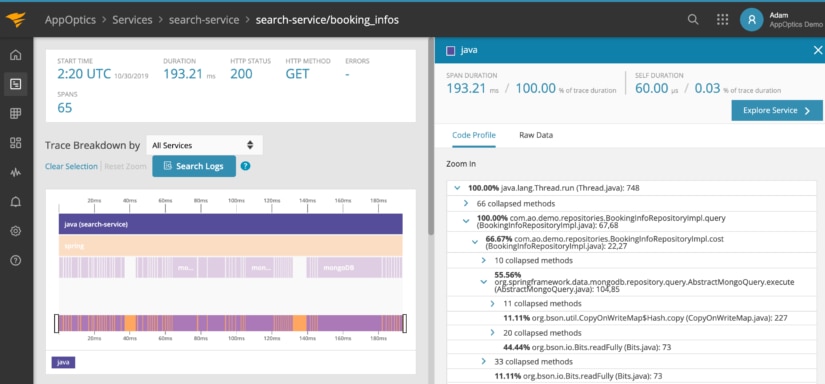
In addition to the new Azure integration, AppOptics now has full APM support for Azure App Service across seven languages. This means you can use the AppOptics APM libraries in applications running in Azure App Service, providing full distributed tracing and code profiling, so you can isolate bottlenecks and performance issues to a specific function or method.
What About Other Factors Affecting Your Application?
Monitoring Azure with AppOptics is only one piece of the puzzle; for example, database calls in Azure might be rate limited because an application is seeing more volume than normal, or a new release introduced a query loop. AppOptics combines application tracing, infrastructure monitoring, and custom metrics in one product to provide a holistic view of the application’s performance, as well as the infrastructure and dependencies supporting it.
For complete end-to-end visibility, SolarWinds Pingdom® and Loggly® provide end user monitoring, synthetic transactions, and log analytics to the SolarWinds APM Suite. Sign up for a free trial of SolarWinds AppOptics and launch your next big feature with more confidence, knowing you have the visibility to catch performance regressions.