Note: This article was originally published on Librato which had since been merged with SolarWinds® AppOptics™. Explore how you can get started with monitoring AWS CloudWatch using AppOptics.
Amazon CloudWatch is a popular option for collecting system and performance metrics from your AWS resources. For some services, it’s the only means available to collect badly needed metrics data. CloudWatch makes it trivially easy to fetch core system metrics like CPU, Network, and Disk, as well as more specialized metrics like queue-sizes and latency numbers from your back-box AWS instances and services like ELB, RDS, SQS, Elasticache, and MapReduce.
Librato: The CloudWatch Interface You’ve Always Wanted
Amazon CloudWatch is a good data collector that provides easy access to two-weeks of metrics data retention for individual instances. For pennies per instance per month, however, you can magnify the power of your CloudWatch data by using Librato as your CloudWatch analysis platform. We’ll automatically import and display your CloudWatch metrics in customizable dashboards that we designed specifically for your AWS metrics.
Librato stores your metrics for a year, together with metrics from any other monitoring systems you use, and makes it trivial to visualize any combination of metrics regardless of source. You can mark significant events on your metrics with our annotation feature, configure an unlimited number of alerts with our advanced alerting functionality, analyze and transform your data with our composite metrics functions, and share the result using our collaboration and snapshot features.
Our integration feature makes setup a snap. First, use the AWS IAM management console to create read-only AWS credentials for Librato to use, and then add CloudWatch to the integrations section of your Librato Account settings. Check out our Knowledge Base article for more specific setup instructions.
No Assembly Required
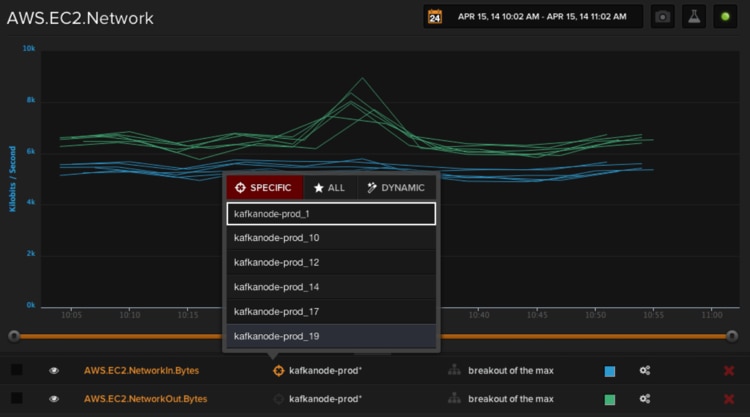
You are free to create an unlimited number of custom dashboards using any combination of the metrics you send us, including your AWS metrics, but when you use our CloudWatch integration, we automatically create a few dashboards for you. In fact, for each type of AWS service you configure (like RDS, ELB, and EC2), we’ll automatically add two dashboards to your Librato account. The first dashboard, simply named ‘AWS <service>’ is configured to display instruments using a detailed breakout of every source from each metric, and the other, named ‘AWS <service> Compact’ uses instruments that aggregate all the sources of each metric in order to show a simplified, single-line graph that cleanly summarizes each metric across all of your instances. The AWS Compact dashboard for the EC2 service is pictured below:
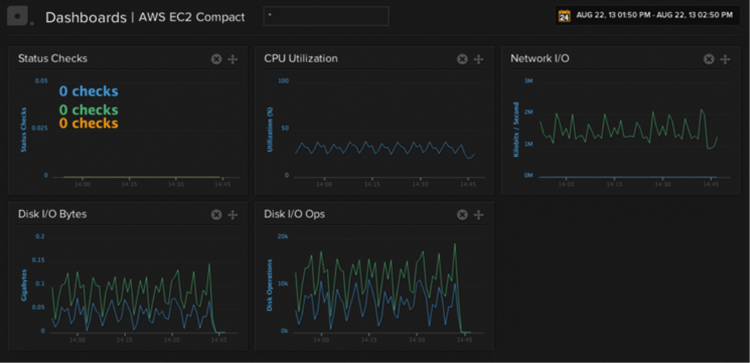
We think you’ll find that our metrics system is quite AWS-aware. You can, for example, give your metric sources meaningful names by changing the EC2 instance tags on your instances. Specifically, if you set the Name tag on an instance, our interface will use that value as the source display name. We’ll even automatically detect and synchronize any changes to the tags going forward, and you can search or wildcard match in our interface using either the AWS-assigned instance ID or the human-readable name specified in either of these tags, and whichever value matches your search is the one we’ll use in the instrument.

Kick It Up A Notch
Storing your CloudWatch data at Librato buys you a first class ticket to our new composite metrics interface, which allows you to perform arbitrary mathematical operations and transformation against any combination of your metrics. For example, at Librato we know that we do more writing to our data-storage layer than reading, but we were curious exactly how much more, so we created this composite metric using the EC2 Disk metrics that CloudWatch collects for us:
divide([sum(s("AWS.EC2.DiskWriteOps","kafkanode*")),sum(s("AWS.EC2.DiskReadOps","metrics_raw*"))])
Graphing this composite metric allows us to see the ratio of writes to reads on our Cassandra cluster. If this line ever dips below 0, we know something probably isn’t right:

Along with the various performance metrics, Amazon includes estimated billing information in your CloudWatch feed. Using our platform, you can visualize your estimated AWS charges on a day-by-day basis. You’ll never be surprised by your Amazon statement again.

Further, once you have your CloudWatch data in Librato, the full power of our alerting platform is at your disposal. You can create an unlimited number of alerts that employ expressive criteria like time windowing, combinatorial triggers, multiple sources, triggering on absent data, and re-arm timers. Further, you can use our alerting integrations to deliver your notifications via myriad protocols and third-party services like PagerDuty, Campfire, OpsGenie, and Hipchat.
For a Fraction of the Cost of your Instance
Pricing for Librato’s CloudWatch integration ranges from $0.05/month per instance for Route 53 to $1.95/month per instance for the 39 metrics generated by an Elasticache Instance. You can add as many metrics from any source as you like, from $0.05/month for 5-minute resolutions, up to $0.30/month for 5 second resolution data streams, and we provide unlimited alerts and API calls at no additional charge. Amazon currently charges $.10/alert per month, so if you rely heavily on CloudWatch alerts, you might be able to use Librato’s integration for the price you’re already spending on AWS 0alerts.
If you’re an Amazon CloudWatch user, we think you’ll find that our metrics platform is a fantastic value. We pick up where CloudWatch leaves off, providing the retention, processing, and visualization to take your CloudWatch metrics from troubleshooting town to the analytics multiverse, for less than the price of toast in San Francisco.