
 Note: This article was originally published on Librato, which has since been merged with SolarWinds®AppOptics™. Explore how to monitor AWS CloudWatch performance using AppOptics.
In the course of their day-to-day work, our engineering team actively relies on our metrics platform to confidently ship code to production and debug problems. They measure and correlate behavior between services on live production workloads, use real-time data to reason about production problems, and add metrics and instrumentation in production to prove their assumptions. We’ve written at length about this process, which we call Metrics Driven Development.
In this article we continue to explore our use of MDD in practice. We will use a shell-one-liner to randomly choose a single metric from among the 60,000 or so we track to make sure SolarWinds Librato™ stays healthy:
paginate listMetrics | jq '.metrics[].name'| sed -ne "${RANDOM}p"
This time, the winner is: AWS.RDS.ReadLatency. This is an interesting choice compared to the custom metric from my last article, because this is an automatically generated metric polled from the CloudWatch API.
CloudWatch is the metrics system built in to Amazon Web Services. If you’re running AWS services, you can enable CloudWatch to periodically poll your services to extract interesting performance metrics. Amazon has a UI that can display these metrics, but it has a few limitations, the biggest of which is probably that it can’t combine multiple sources on the same graph. The good news is Amazon also exports all CloudWatch metrics via a web API, so to get around this and several other limitations, we import our CloudWatch metrics into Librato using our own AWS integration feature.
Setting it up is really easy (seriously, I wish all integrations were this easy).
Just click the integrations button in the spaces title bar:


Then click the AWS button and paste in your read-only AWS credentials. Once those are saved, Librato will begin polling AWS’s API to extract and persist your AWS metrics. We even automatically set up some AWS Dashboards for whatever combination of services you’re running.
In this case, our AWS.RDS.ReadLatency metric is one of the CloudWatch metrics automatically collected on RDS instances (the AWS-hosted MySQL service). You can find a full list of these metrics here.
Read Latency in this context refers to, in AWS’s words, “The average amount of time taken per disk I/O operation”. The default polling interval for RDS metrics (as set by Amazon) is 1 minute. So, to derive this metric, AWS measures the length of time each disk read takes, and divides the sum of those measurements by the number of measurements taken in every one minute interval.

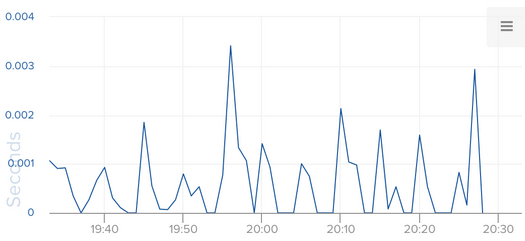
Good metrics teach us about how the things we build behave in the wild under production workloads. By this measure, AWS.RDS.ReadLatency falls a bit short. The problem is the data has already been averaged by AWS before it arrives in the Librato UI. So it’s hard to tell whether a high read-latency number might have been caused by contention—many short-lived simultaneous reads — or an application layer problem with the client or DB that’s causing a singular long-running query.
Had this been a Librato native metric, the measurement count for each interval would have been preserved along with the one-minute average, but luckily, CloudWatch also happens to export the count as a separate metric called AWS.RDS.IOPS. Overlaying these two metrics gives us a nice visual representation of how our MySQL read latency is related to the cardinality of disk reads.


Good metrics test systems hypotheses; they confirm or disprove the assumptions we make when we design distributed applications. At Librato, for example, we receive over a million measurements per second from our customers, each of which must be processed, aggregated, analyzed, and ultimately persisted. So, we expect to write data a lot more often than we read it.
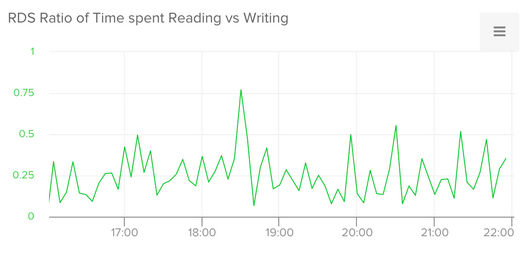
We can use operational metrics from many different services to test this hypothesis, including computing the ratio of time we spend reading from disk versus writing to disk on our RDS instances. I used CloudWatch metrics with the following composite metric to compute this ratio:
divide([sum(s("AWS.RDS.ReadLatency","%")),sum(s("AWS.RDS.WriteLatency","%"))])
The data, as you can see below, confirms our suspicion, which is a relief. If we suddenly find ourselves with a read-to-write ratio above 1, our system is doing something we don’t expect.

I hope you’ve enjoyed our glimpse into this little corner of Librato’s operational KPIs. AWS Cloudwatch and Librato work quite well together to give you a high-degree of actionable operational visibility, with a near-zero setup time.