Note: This article was originally published on Librato, which has since been merged with SolarWinds®AppOptics™. Explore how to monitor AWS CloudWatch using AppOptics.
There is a pervasive urban myth holding that humans only use 10% of their brain capacity. Much as it’s been deconstructed over and over, it refuses to die. I think it rings true because we all believe to some extent that there is, hidden within each of us, untapped potential.
Operational and business metrics, however, represent the untapped potential hidden within our applications and business processes. A well designed telemetry system gives us the visibility we need to diagnose and respond to problems, but it also provides a means to access that potential—to do more with what we already have.
If you use AWS today, CloudWatch offers easy access to a wide range of metrics that serve as a fantastic basis for understanding your cloud application. But truly leveraging that data to its full potential is not easy. Here is how to get closer to that goal with Librato CloudWatch integration.
1. Mind the Trends
CloudWatch only persists two weeks’ worth of data. Short-term data like this is essential for troubleshooting and monitoring server behavior after a release, but considerable savings come with being able to streamline services for day-to-day use. Librato persists your CloudWatch data for a year, enabling you to spot trends and forecast over time.
In this instrument, for example, our engineers are tracking a four-week-long increase in response time in a critical service.


2. Annotate
The ability to document aperiodic events like release dates, deploys, marketing campaigns, and upgrades to your AWS package, enables you to correlate those events with your metric data. In this chart, our engineers are using an annotation to quantify the amount of read-I/O generated by reducing the size of the database cluster by one node.


Without annotations, understanding variations in use can be painful and time-consuming.
3. Let Your Data Work For You
While tracking your AWS metrics is important, you can’t be glued to them all day. By adding customizable alerts through email, webhooks or a third-party escalation service, you can set parameters to let your data notify you when it needs attention. Librato allows you to configure an unlimited number of alerts for free.
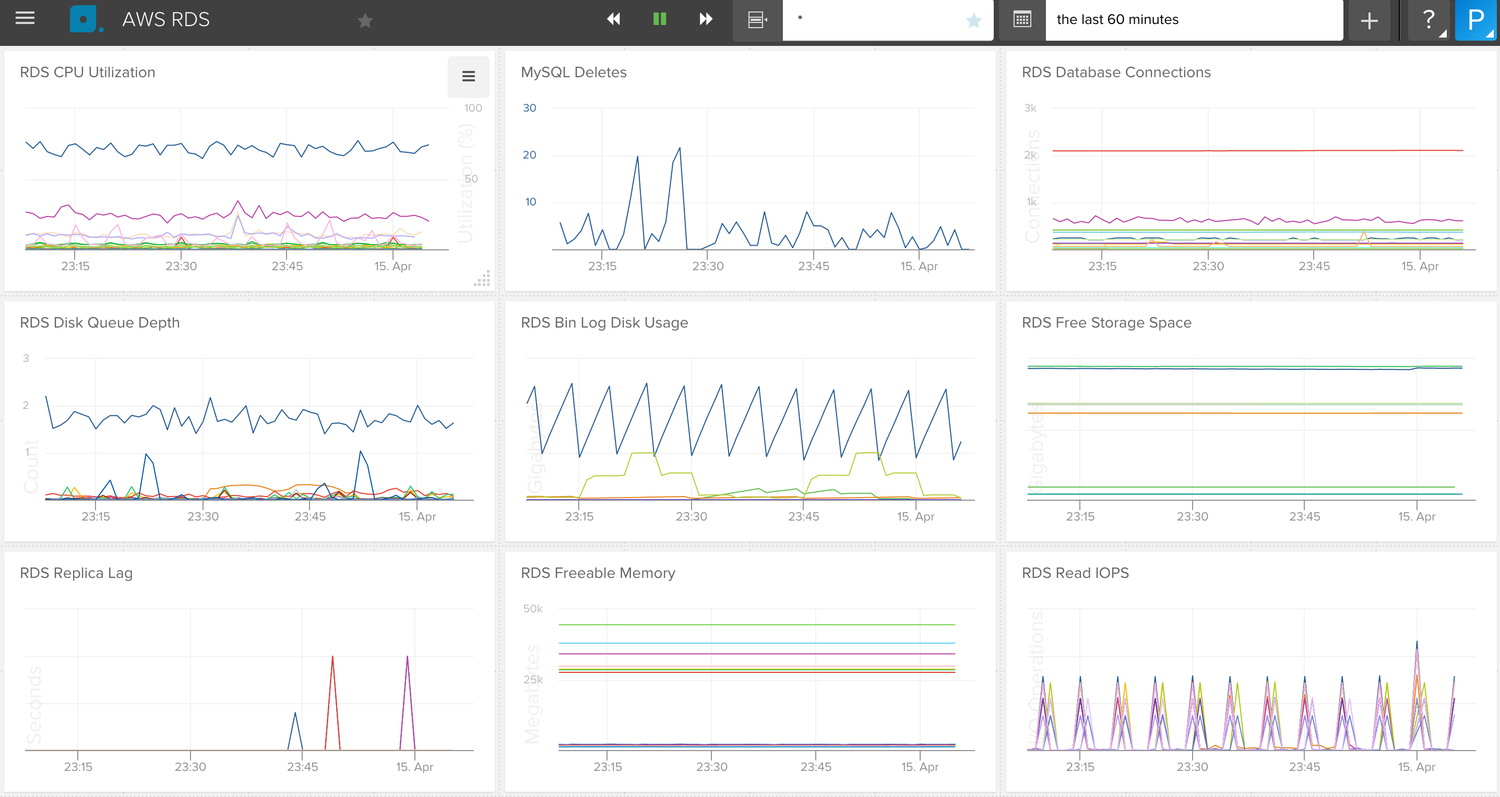
4. Correlate
CloudWatch makes it difficult to compare the same metric across instances, but Librato’s charts automatically group your instances together by metric. You can filter the instances displayed in a chart by your AWS Tag names, or even create custom charts that show exactly the groups of hosts you need. Librato comes with predefined dashboards, enabling you to see all of your CloudWatch data together, and allows you to create an unlimited number of custom dashboards for free.

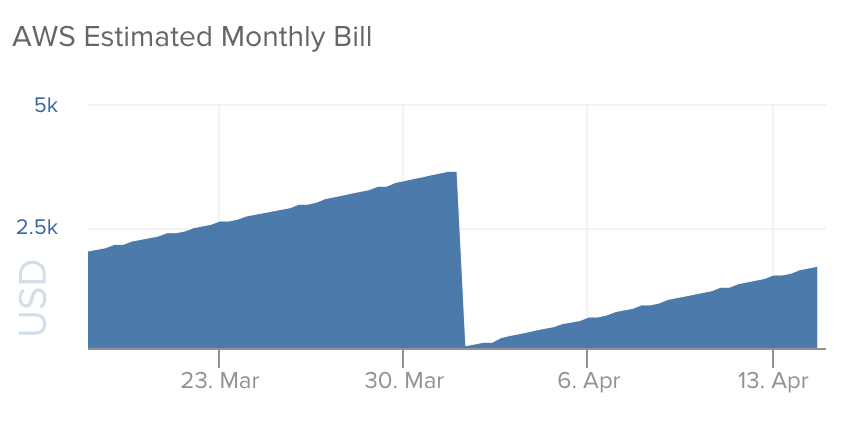
5. Don’t Let Your Bill Catch You By Surprise
SaaS sprawl can cost you a small fortune if you don’t have a handle on it. Keeping a constant eye on how much you’re spending can help you plan effectively. Librato provides daily estimates for AWS expenses, allowing you to scale services to meet the needs of both your customers and your bottom line.

The larger opportunity here is not to see some new piece of data that you’ve been missing, but to begin seeing how each metric you have interacts with others to provide a more nuanced picture of your AWS use. Librato lets you do more with the data you have: in turn, you get to work smarter, not harder.