In this post, we provide a guide on how AppOptics can be used in application performance monitoring in a testing environment. One of the most important features of GNS3 is the creation of virtual networks with virtual devices. In combination with applications running inside Docker’s containers, we’re able to simulate a production environment that can be monitored by AppOptics. Before you begin, you must have:
- GNS3 with Docker’s support. On Windows, it is necessary to have installed GNS3 VM.
- An AppOptics account
Get Started
1. Create an AppOptics account
If you don’t already have an AppOptics account, you will need to create one. You can try AppOptics free for 14 days.
2. Download the lab
AppOptics lab for GNS3 is available in the GNS3 Marketplace in the Labs section. The lab needs to be downloaded to a local computer. Please remember the lab is heavily using features hence, on Windows, it is required to use GNS3 VM.
3. Import into GNS3
Once the lab is downloaded, it is necessary to import the project into GNS3.

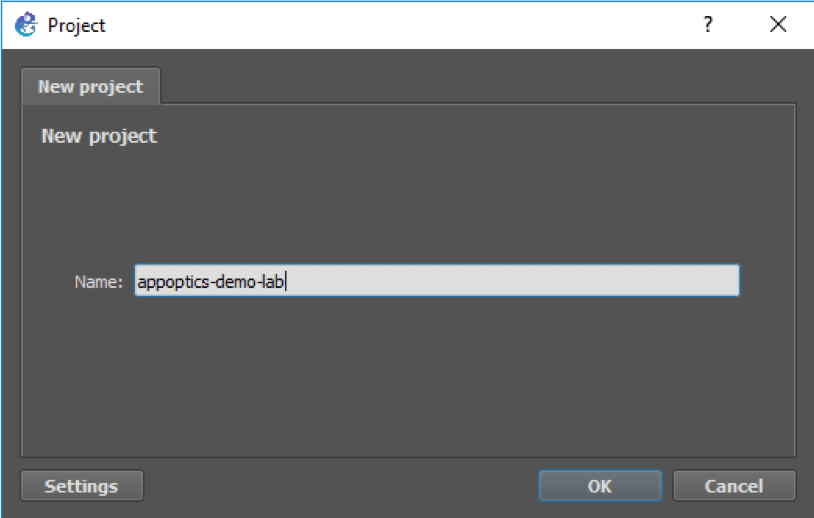
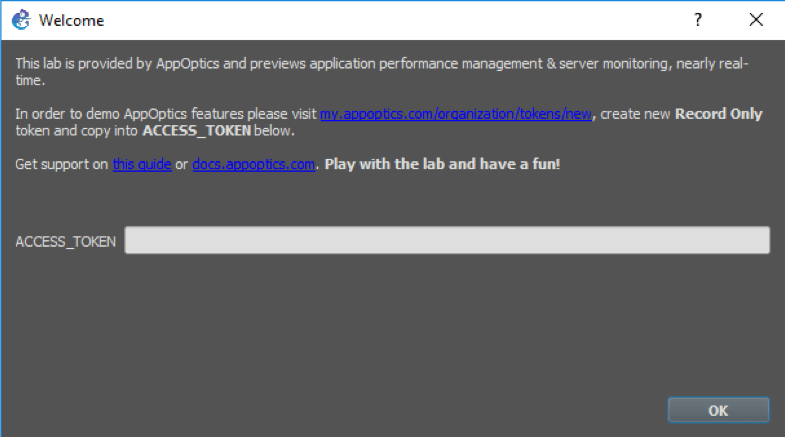
During the import process, you will be asked to provide an access token. Please stop here, leave the dialog open, and go to the next step. We will return to GNS3 soon.
Setup
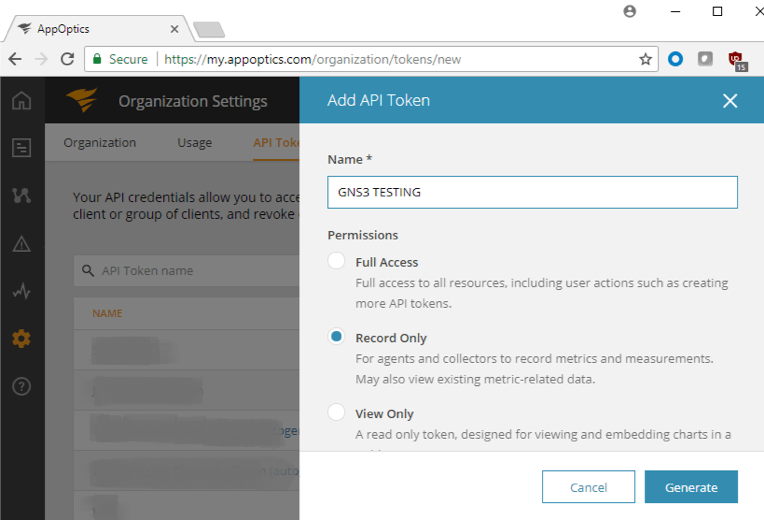
1. Generate a new access token
AppOptics clients installed into applications communicate with servers located in the cloud. To authorize communication, it is necessary to obtain an access token in the AppOptics control panel. The access token is a simple pseudo-random text. Please visit the new token generation page in AppOptics to get this. The client needs, at minimum, Record Only permission, which allows write-only access to new records in the database.
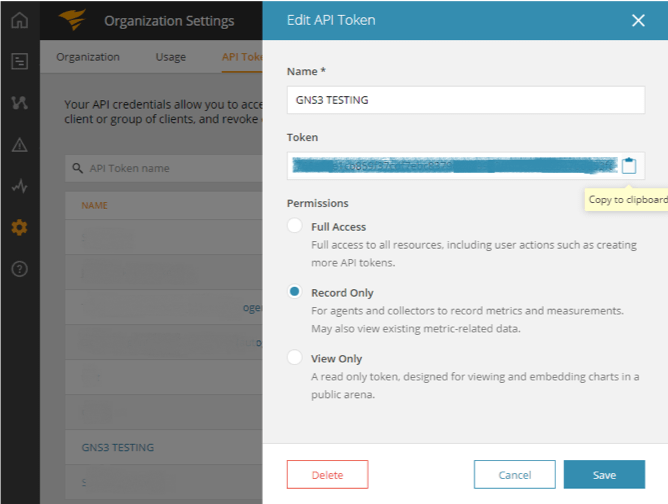
2. Copy the access token to clipboard
Once we generate the new access token, please copy it into the clipboard by clicking the icon on the right side of the token.
3. Paste into ACCESS_TOKEN field
Now we’re getting back to the GNS3. Please paste access token into the text box located on the Lab Welcome Dialog.
Running the Lab
1. Get it running
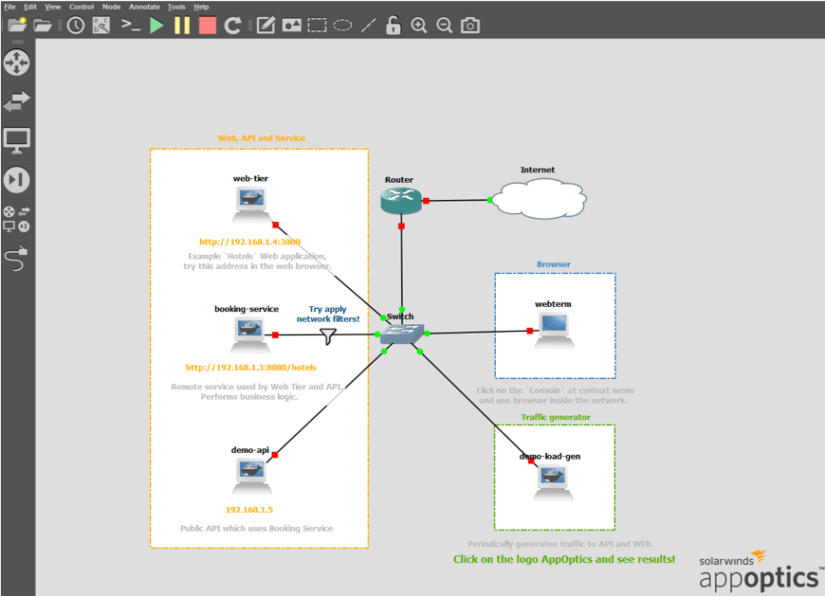
The lab consists of multiple applications running on Docker containers and routers, which connects them to the network. We can point out three main applications that can be monitored: web-tier, booking service, and demo-API. On each of them, there is a preinstalled AppOptics client which sends information to cloud.
After importing the lab, we should see the topology of elements. However, most of them are stopped, and it is necessary to run all containers and routers inside.
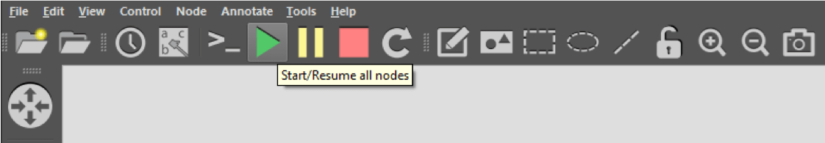
To do so, please click on “Start/Resume all nodes”. All small red squares next to containers should become green dots.
2. Check demo applications
Even when all the containers have started, it may take a couple of seconds (or minutes) to make them functionally running. When all of them are ready, it is possible to see them in browsers. Next, please right-click on Webterm and go to the Console item in the context menu.
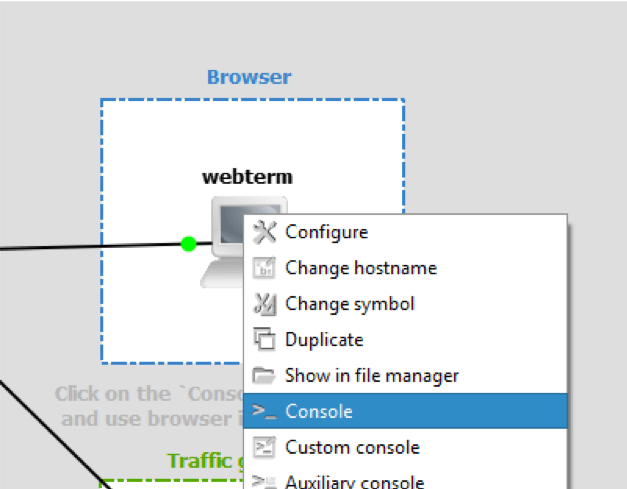
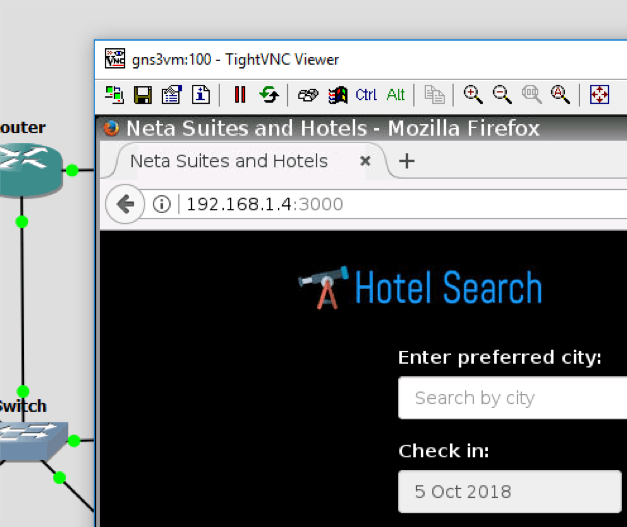
You should now be connected to the “computer” inside the topology. If the browser is not open, please open it and type the following into the URL: http://192.168.1.4:3000. This is the main demo application. If you can see the demo hotel site, it means everything is running as expected.
Monitor Your Application
1. AppOptics shortcut
While working on this lab, we are frequently switching between GNS3 and AppOptics. To make it easier, please remember it is always possible to directly go to AppOptics by clicking on its logo in the bottom right corner of topology.
2. Find demo services
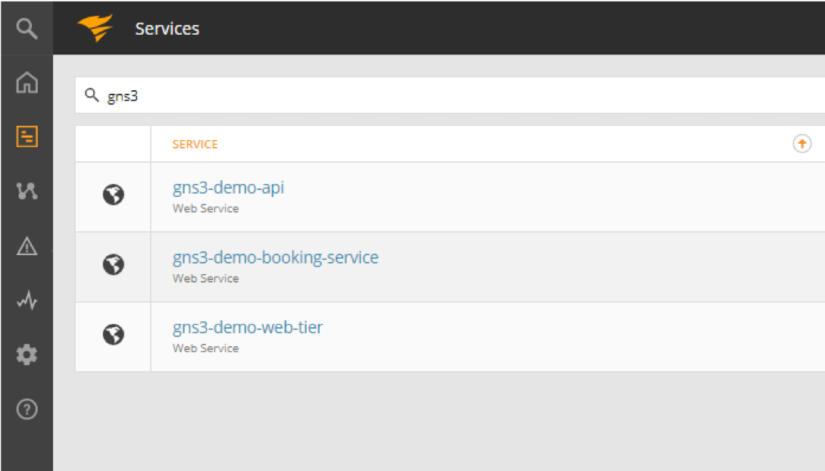
After a few minutes of running the lab, we can see our applications (called “Services”) in AppOptics with basic health information. Please click on the logo or go to https://my.appoptics.com/. If you’re already monitoring other applications, it may be useful to filter the list by keyword “gns3”. Otherwise, our new services should be on the top.
On the list of services, we can immediately spot if our applications are running by looking at average response time (in milliseconds), number of requests (requests per seconds) and error rate (percentage). Demo applications need some time to be up-and-running, hence error rate can be 100%. Over time, it should go down to 0%.

3. AppOptics service
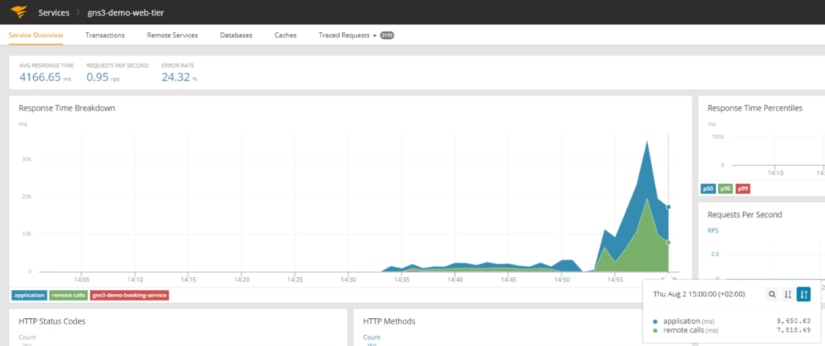
Clicking on the particular service lets us see details of the current state, including response time breakdown, percentiles, and requests per second.
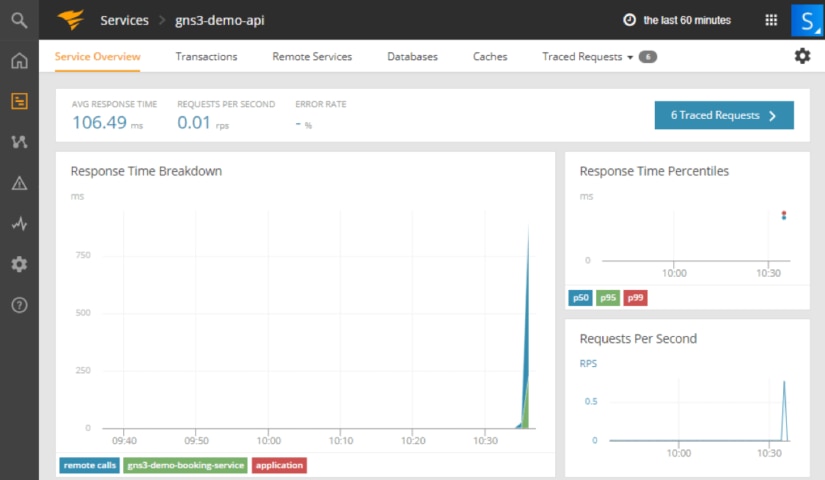
AppOptics provides a breakdown of the response—what took most time inside the application to provide a response. Move the mouse over to an interesting point of time to get results. In our demo, gns3-demo-api spends time on remote calls, gns3-demo-booking-service, and a little inside application itself.

4. Trace requests
Another feature of AppOptics is tracing requests. Click on “Traced Requests”.
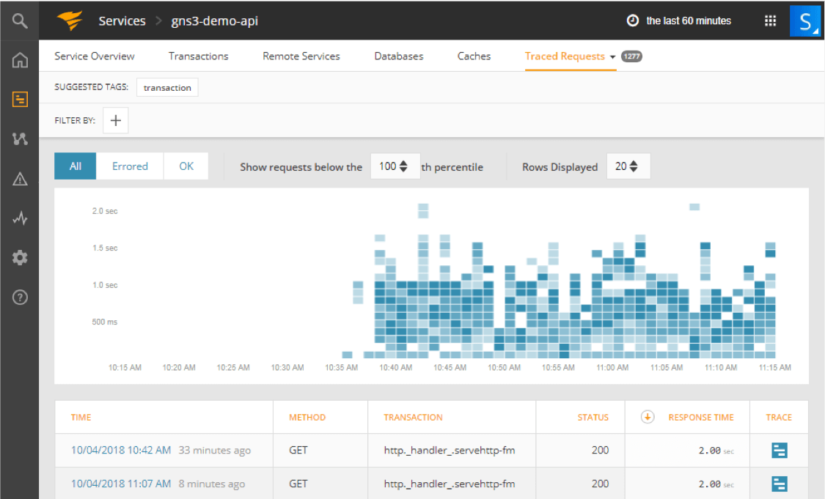
In this section, we can observe all requests which have been made to our application with correlation to transaction and response time.

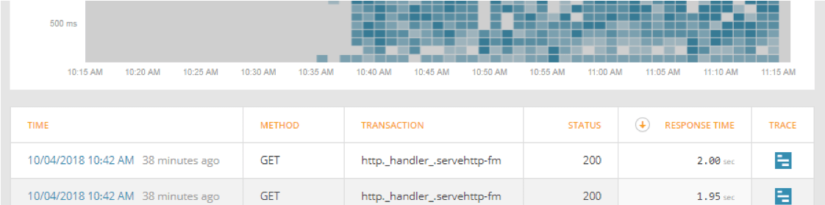
We can filter results by selecting the area of the response time chart. It’s an easy way to find the slowest pages in our demo application and potentially troubleshoot problems.
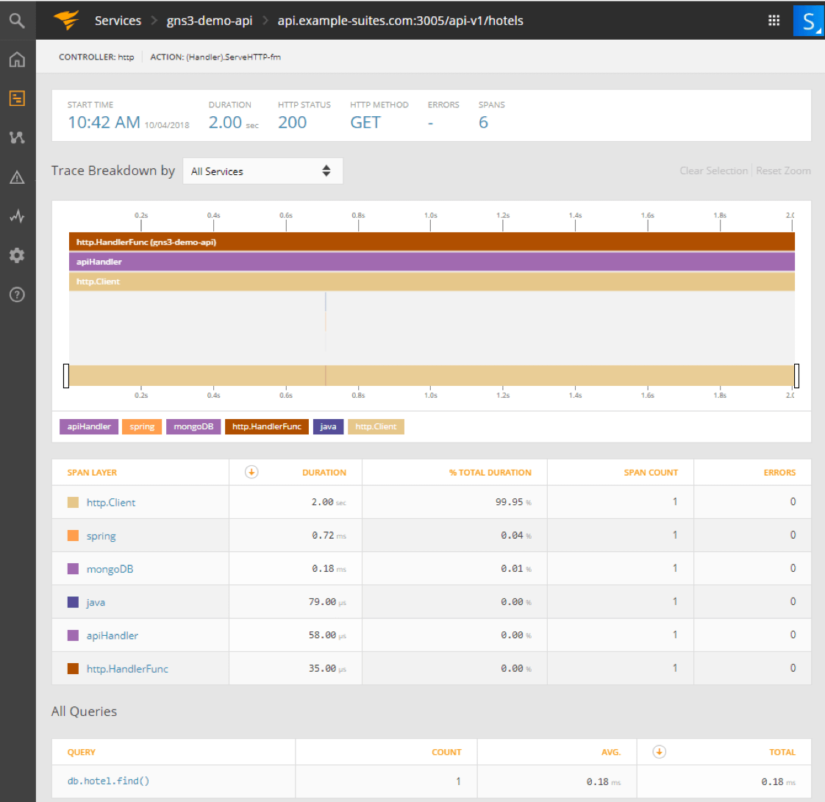
4.5. Request details
Clicking on the trace icon next to the request shows us layers of application where we can discover which layer is the most time-consuming. Next to the list of layers, there is a list of queries to data storages, such as SQL, NoSQL, and others. Layers separation and queries breakdown are useful during debugging.
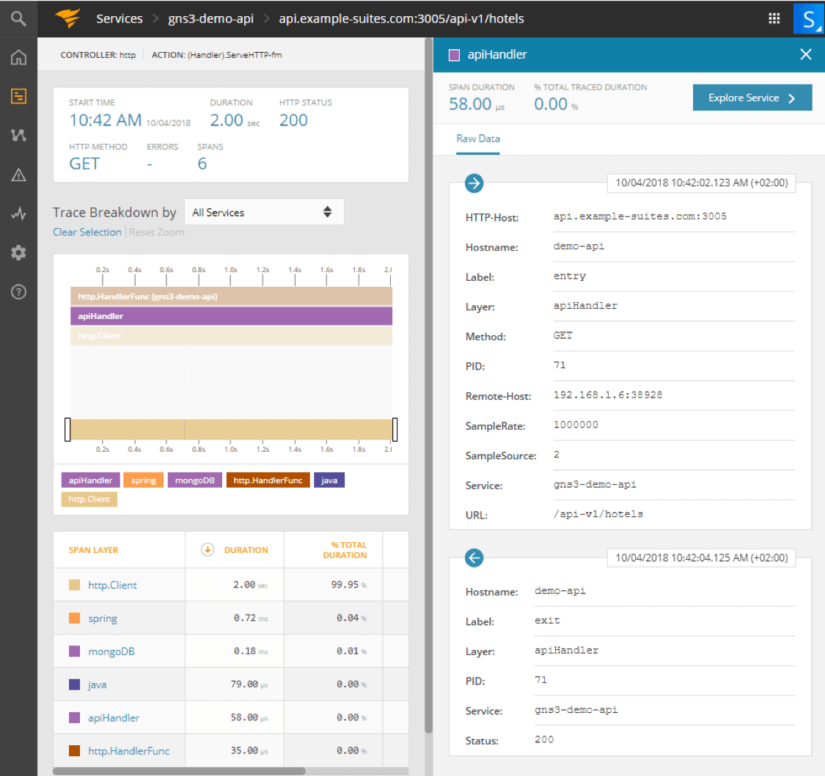
If you click on the layer, you can get details and retrieve all necessary information.
Play With the Lab
1. Apply filters
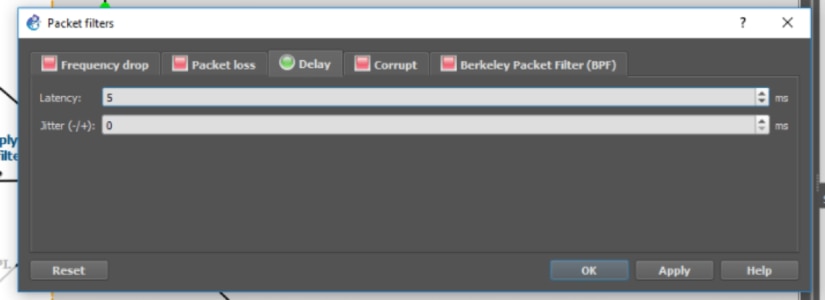
Our lab is fully interactive and can be modified to test different scenarios. One of the features of GNS3 is applying connections filters. Let’s try to increase delay between booking-service, web-tier, and demo-api. Right-click on the booking-service <-> Switch line and select Packet filters.

Go to the Delay tab and increase latency to 5 or higher. Please remember we’re defining it per direction, which should result with total 10 millisecond delay (request, response).
2. Preview changes in AppOptics
After a few seconds (or minutes) we can see increased response time in AppOptics.
Conclusion
In this guide, we tested monitoring services of applications in virtual environments. GNS3 can emulate both networks and applications, which makes it perfect for any kind of training and testing. We encourage modifying topologies to simulate real-case scenarios, like what happens when one of the services is down or impacts other parts of the system, and see how it can be monitored. This can reduce troubleshooting time when the same situation occurs in a production environment.