
We’re excited to announce new features in AppOptics that make it easier than ever to get insights into database, cache, and remote service performance.
Sometimes applications are slow because the code is just plain slow, but in 8 years of monitoring web performance, we’ve found that the culprit is more often in the interaction of the application’s code and external systems—in particular, databases, remote services, and caches.
In AppOptics, distributed tracing gathers data on how all the services that make up applications work together to process requests, including both custom-developed services as well as packaged applications and third-party endpoints. In addition to being available in detailed traces, we also extract the performance data to let users answer questions like:
- Am I spending a lot of time in the database? What are my most expensive queries?
- Which database tables are experiencing contention?
- Is this third-party API reliable?
- Is my memcache/redis/etc. caching effective?
Here are some quick highlights of the new features:
Quickly find bottlenecks and sources of high utilization
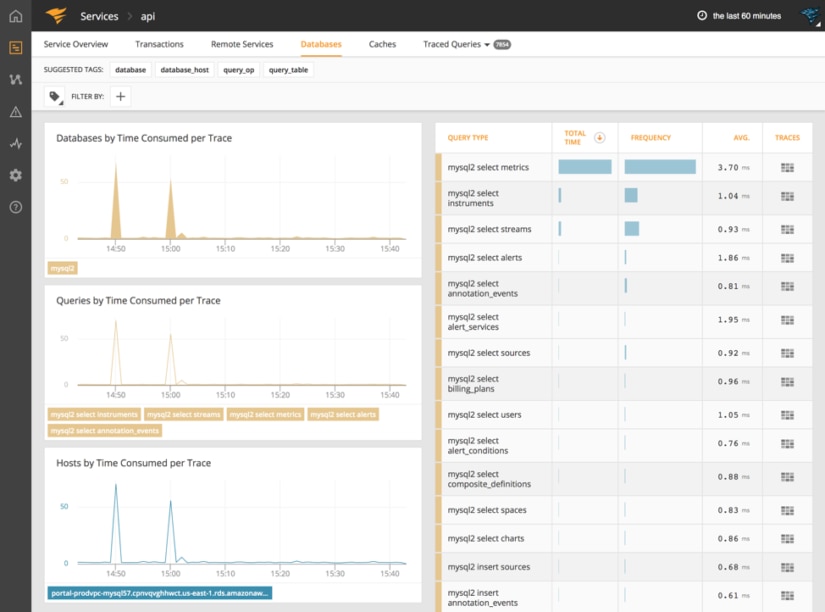
AppOptics now indexes queries, cache operations, and remote calls as metrics along a number of dimensions. Quickly scan the displayed information to find problematic operations, tables, and services. Apply filters to refine, or drill down for more information.
Monitor both internal and external services

Your application may use a combination of both internal services and third-party/IaaS APIs. For internal services, jump directly into their performance in AppOptics. For third parties, keep track of performance and drill down to individual traces to understand behavior.
Find the exact trace you’re looking for
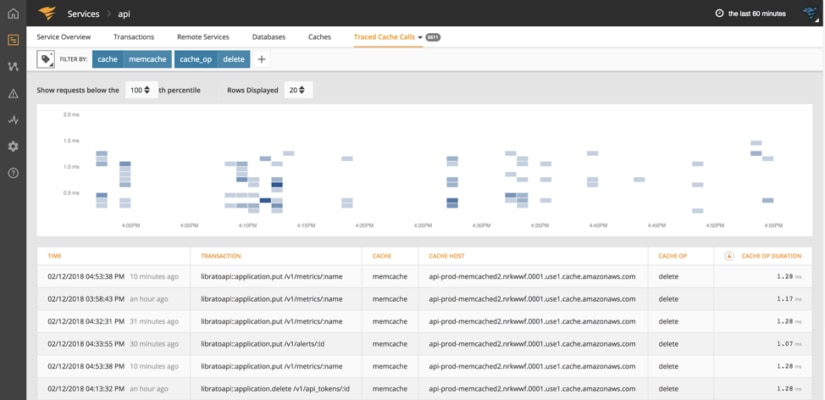
Sometimes you need to go from metrics observing a trend to traces exhibiting the actual underlying phenomenon. Now, the same options are available for slicing metrics as on filtering traces. In the example above, see what happens when the application makes a DELETE call to memcache, along with traces showing where in the code it’s coming from.
Just the tip of the iceberg
There’s more to share—read on in our documentation:
Check out a free trial of AppOptics today!
The SolarWinds trademarks, service marks, and logos are the exclusive property of SolarWinds Worldwide, LLC or its affiliates. All other trademarks are the property of their respective owners.