A comprehensive set of turnkey infrastructure integrations

Including dozens of AWS and Azure services, web, database, network, containers, orchestrations like Docker and Kubernetes, and more.

START FREE TRIAL

Complete visibility into the health and performance of applications and their underlying infrastructure

Quickly pinpoint the root cause of performance issues across the stack, down to a poor-performing line of code

START FREE TRIAL

Custom metrics and analytics

Analyze custom infrastructure, application, and business metrics

View Custom Metrics Monitoring Info
Powerful API that makes it easy to collect and create any custom metric

Achieve ultimate visibility and enhanced troubleshooting with synthetic and real user monitoring

START FREE TRIAL

Free APM Software

Catch bugs early on, and gain full visibility and insights into the applications you’re developing

View Product Info
Free, full-function APM tool for testing and troubleshooting application performance before moving into production

Dev Edition includes five traces per minute, 100 metrics, three hosts, and six containers

GET FREE TOOL

Log Management and Analytics powered by SolarWinds Loggly

Integrated, cost-effective, hosted, and scalable full-stack, multi-source log management

View Log Management and Analytics Info
Collect, search, and analyze log data in addition to your metrics and traces to quickly pinpoint application performance problems

Reduce mean time to resolution (MTTR) by quickly jumping from a trace or host view into the relevant logs to accelerate troubleshooting

START FRE TRAIL

Digital Experience Monitoring Powered by SolarWinds Pingdom

Make your websites faster and more reliable with easy-to-use web performance and digital experience monitoring

View Digital Experience Monitoring Info
Add client-side web application performance monitoring. Provide maximum observability by adding the user’s perspective.

Achieve ultimate visibility and enhanced troubleshooting with synthetic and real user monitoring

START FREE TRIAL

AppOptics recently introduced a revamped infrastructure view which includes a Host Map. We hope that it’s helping you identify and resolve issues quickly on your infrastructure.

Today, we want to introduce yet another useful feature, especially if you’re also a Papertrail user. You’re now able to trail your host directly from AppOptics to Papertrail and see its logs.

This is super handy when you’ve identified a host with high resource utilization or high error counts and want to actually find out what’s happening in that host through its logs.

How to trail into Papertrail from AppOptics

AppOptics and Papertrail are part of SolarWinds Cloud® product suites that offer deep visibility into your applications and infrastructure.

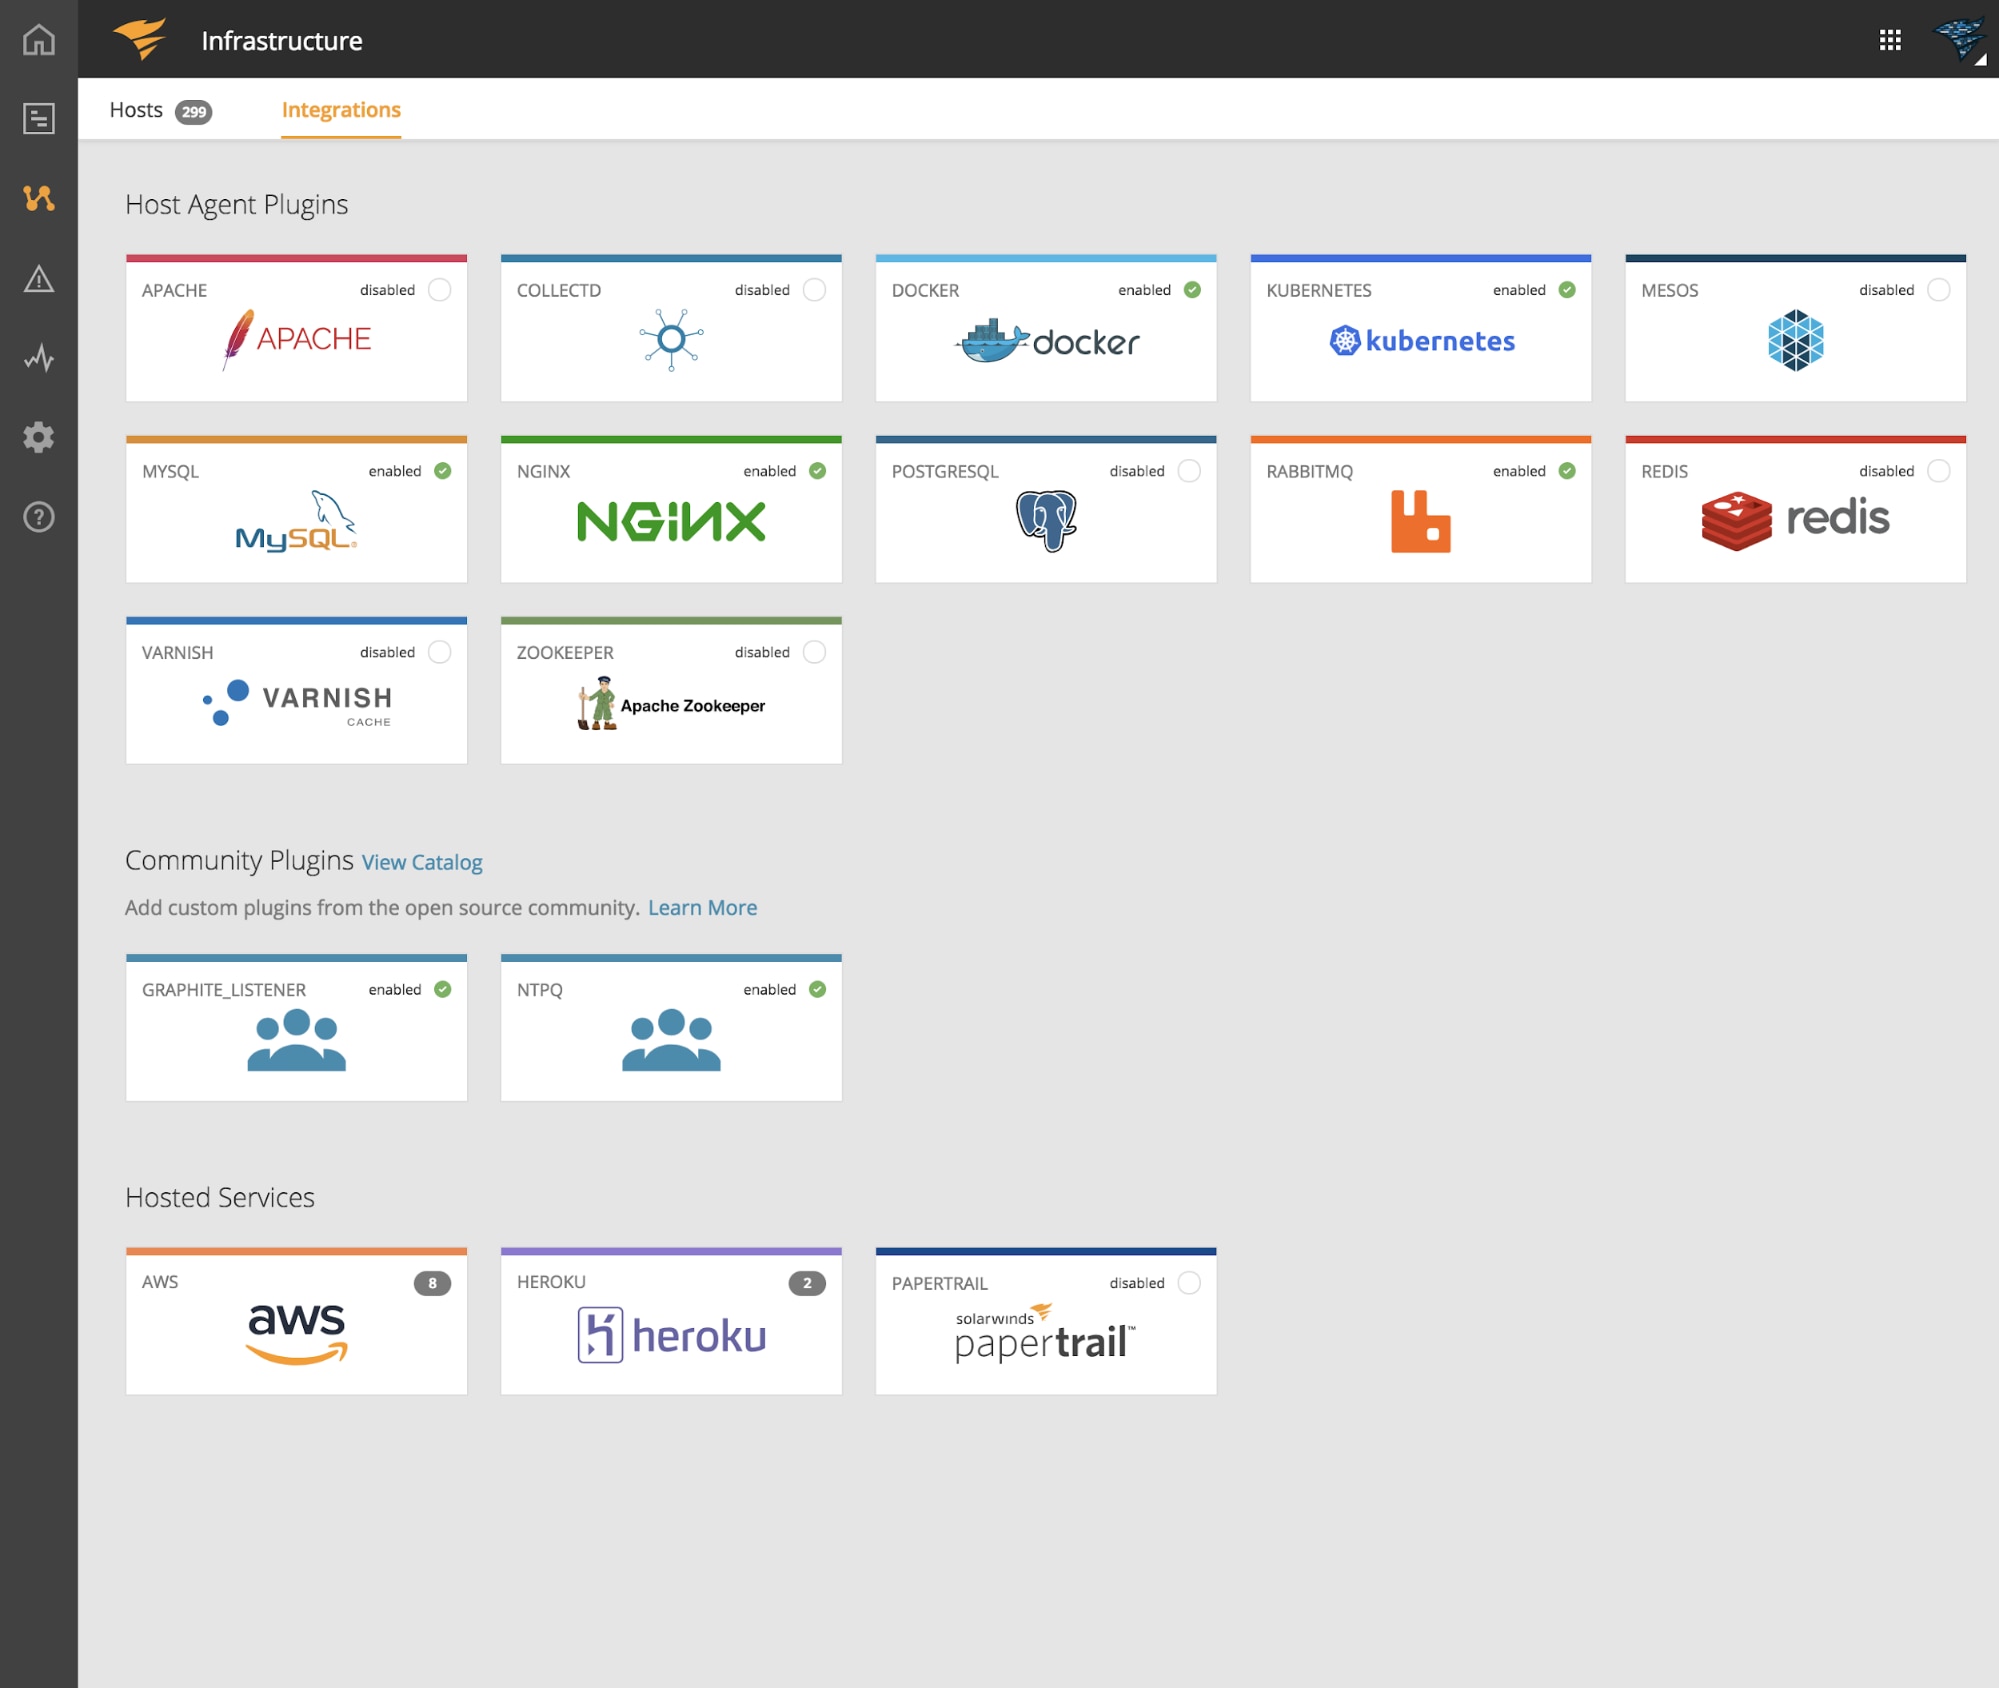
How do you get started? Quickly head over to the Integrations page in AppOptics, and you’ll see Papertrail listed under the Hosted Services section.

Prerequisite: You should be sending your server logs into Papertrail

Figure 1: You’ll find Papertrail integration under the Integrations page

Click on the Papertrail integration card to bring up the configuration panel.

Figure 2: Just press on “Enable” to turn on the Papertrail integration in AppOptics


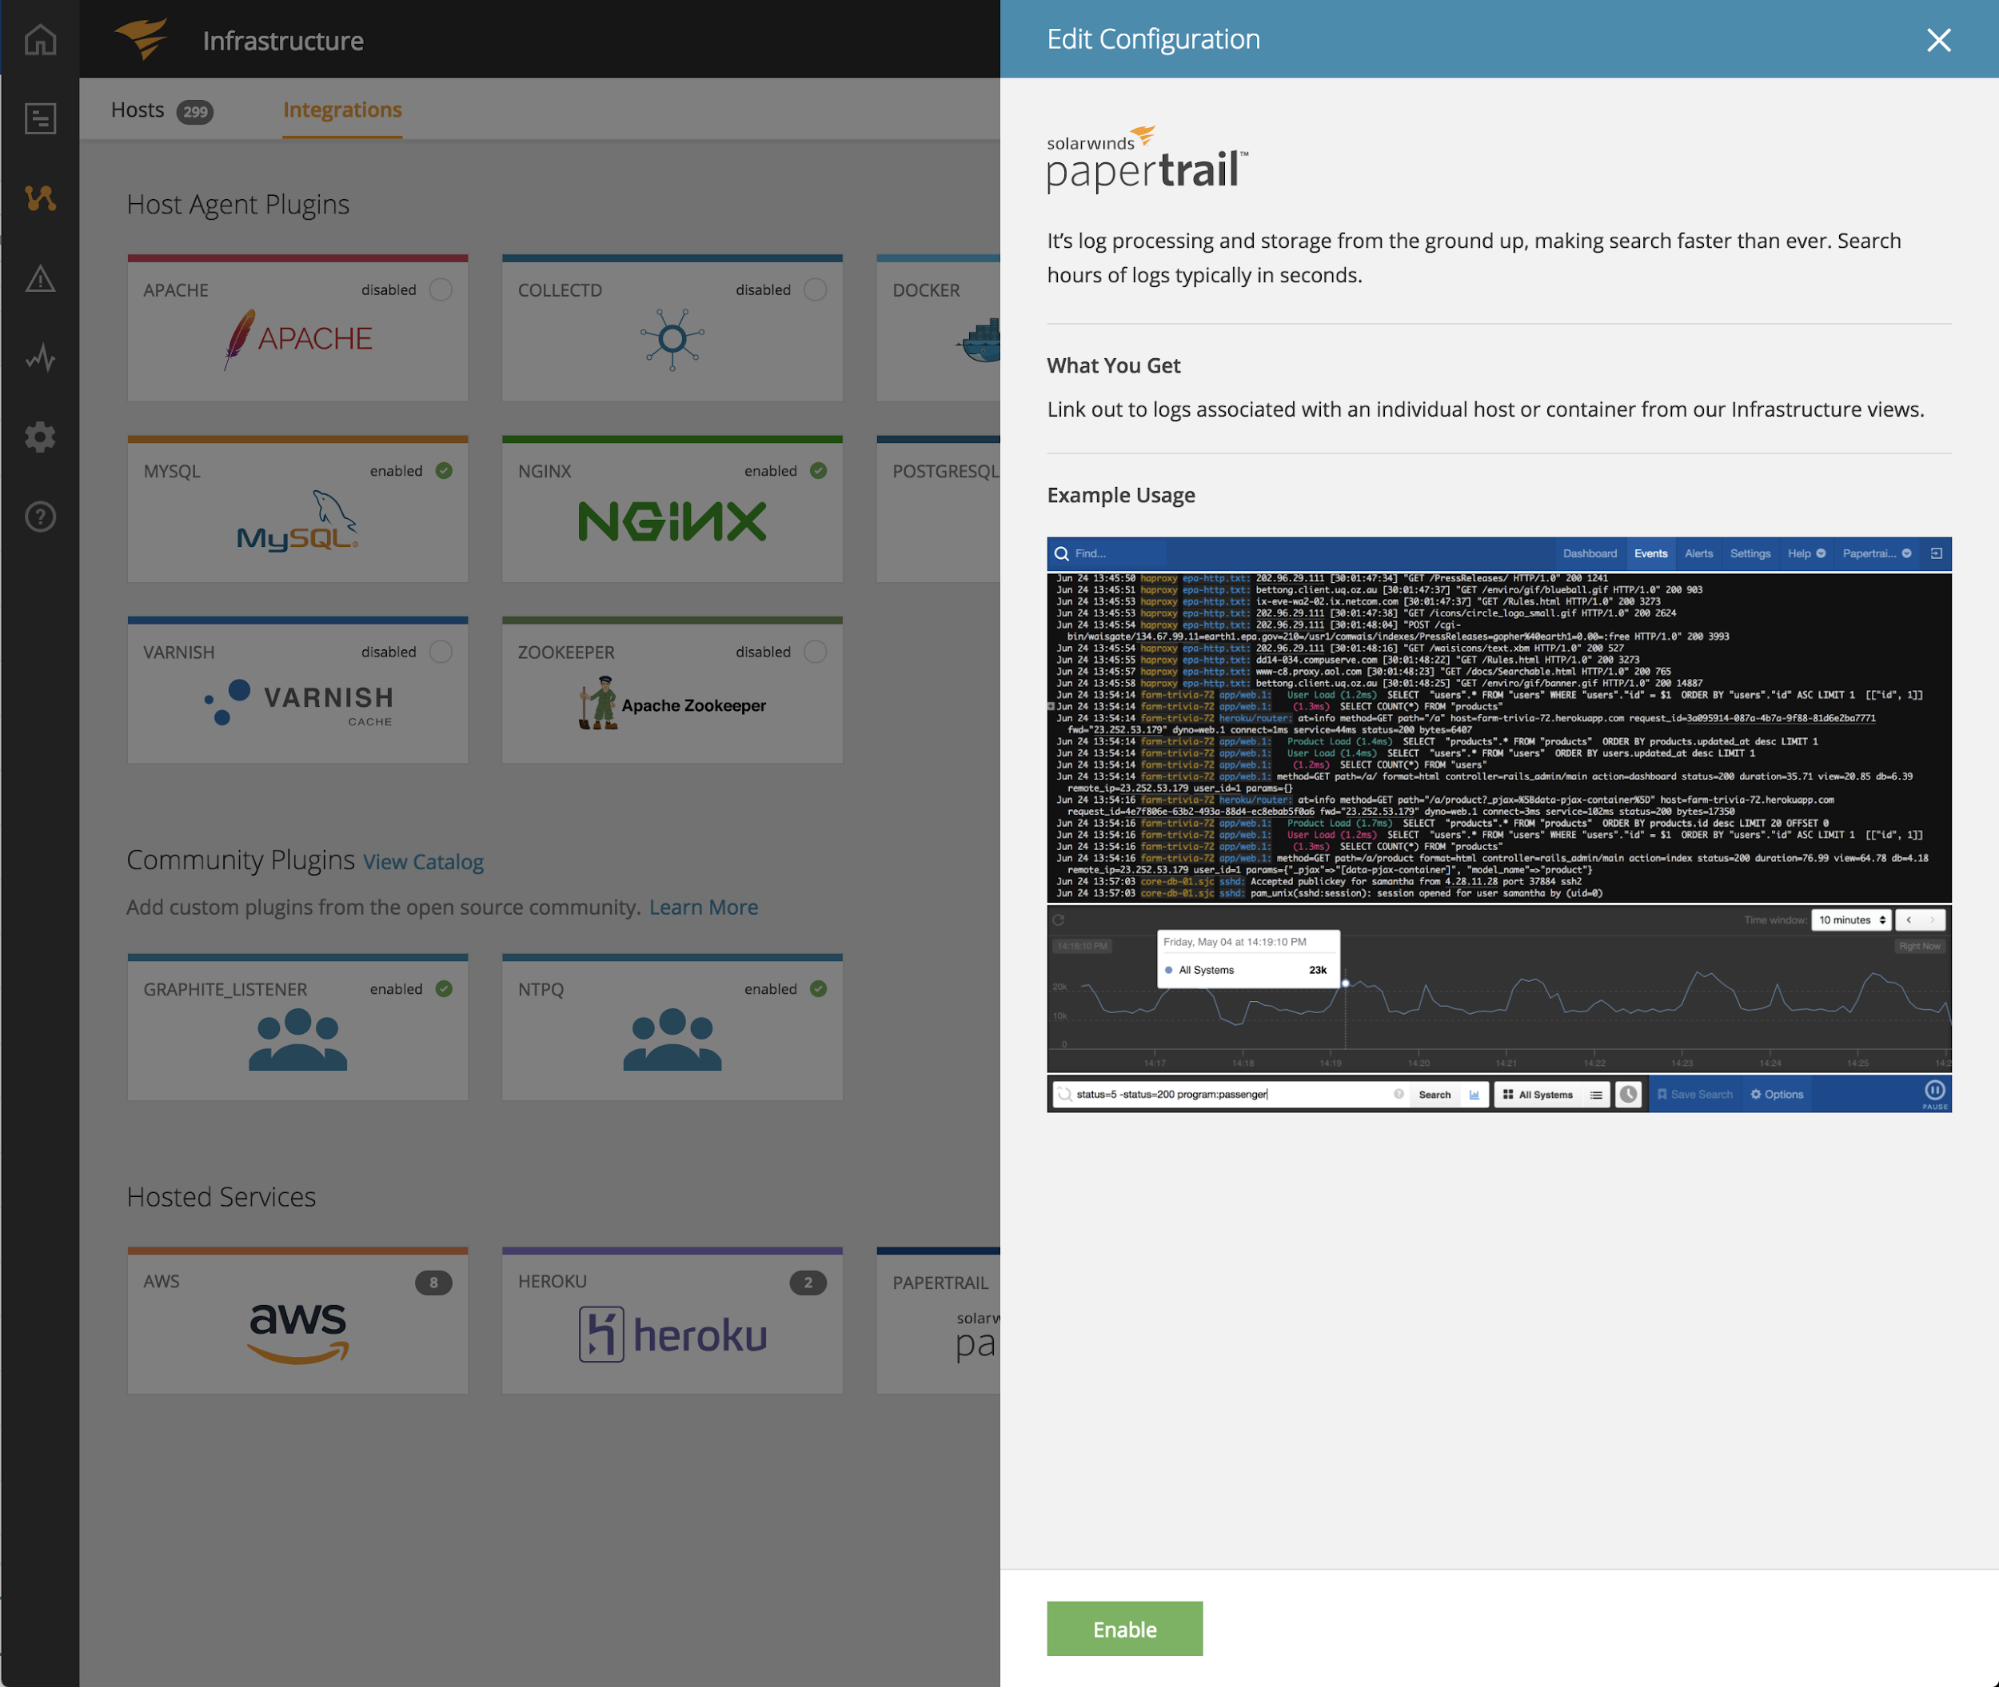
It’s a very straightforward configuration to turn on the Papertrail integration in AppOptics. Just press the “Enable” button.

Once the Papertrail integration is enabled, you’ll see a link to open the Host Logs in Papertrail available on the Host Details card.

Figure 3: Host Details card now has a link to open up the Host Logs in Papertrail

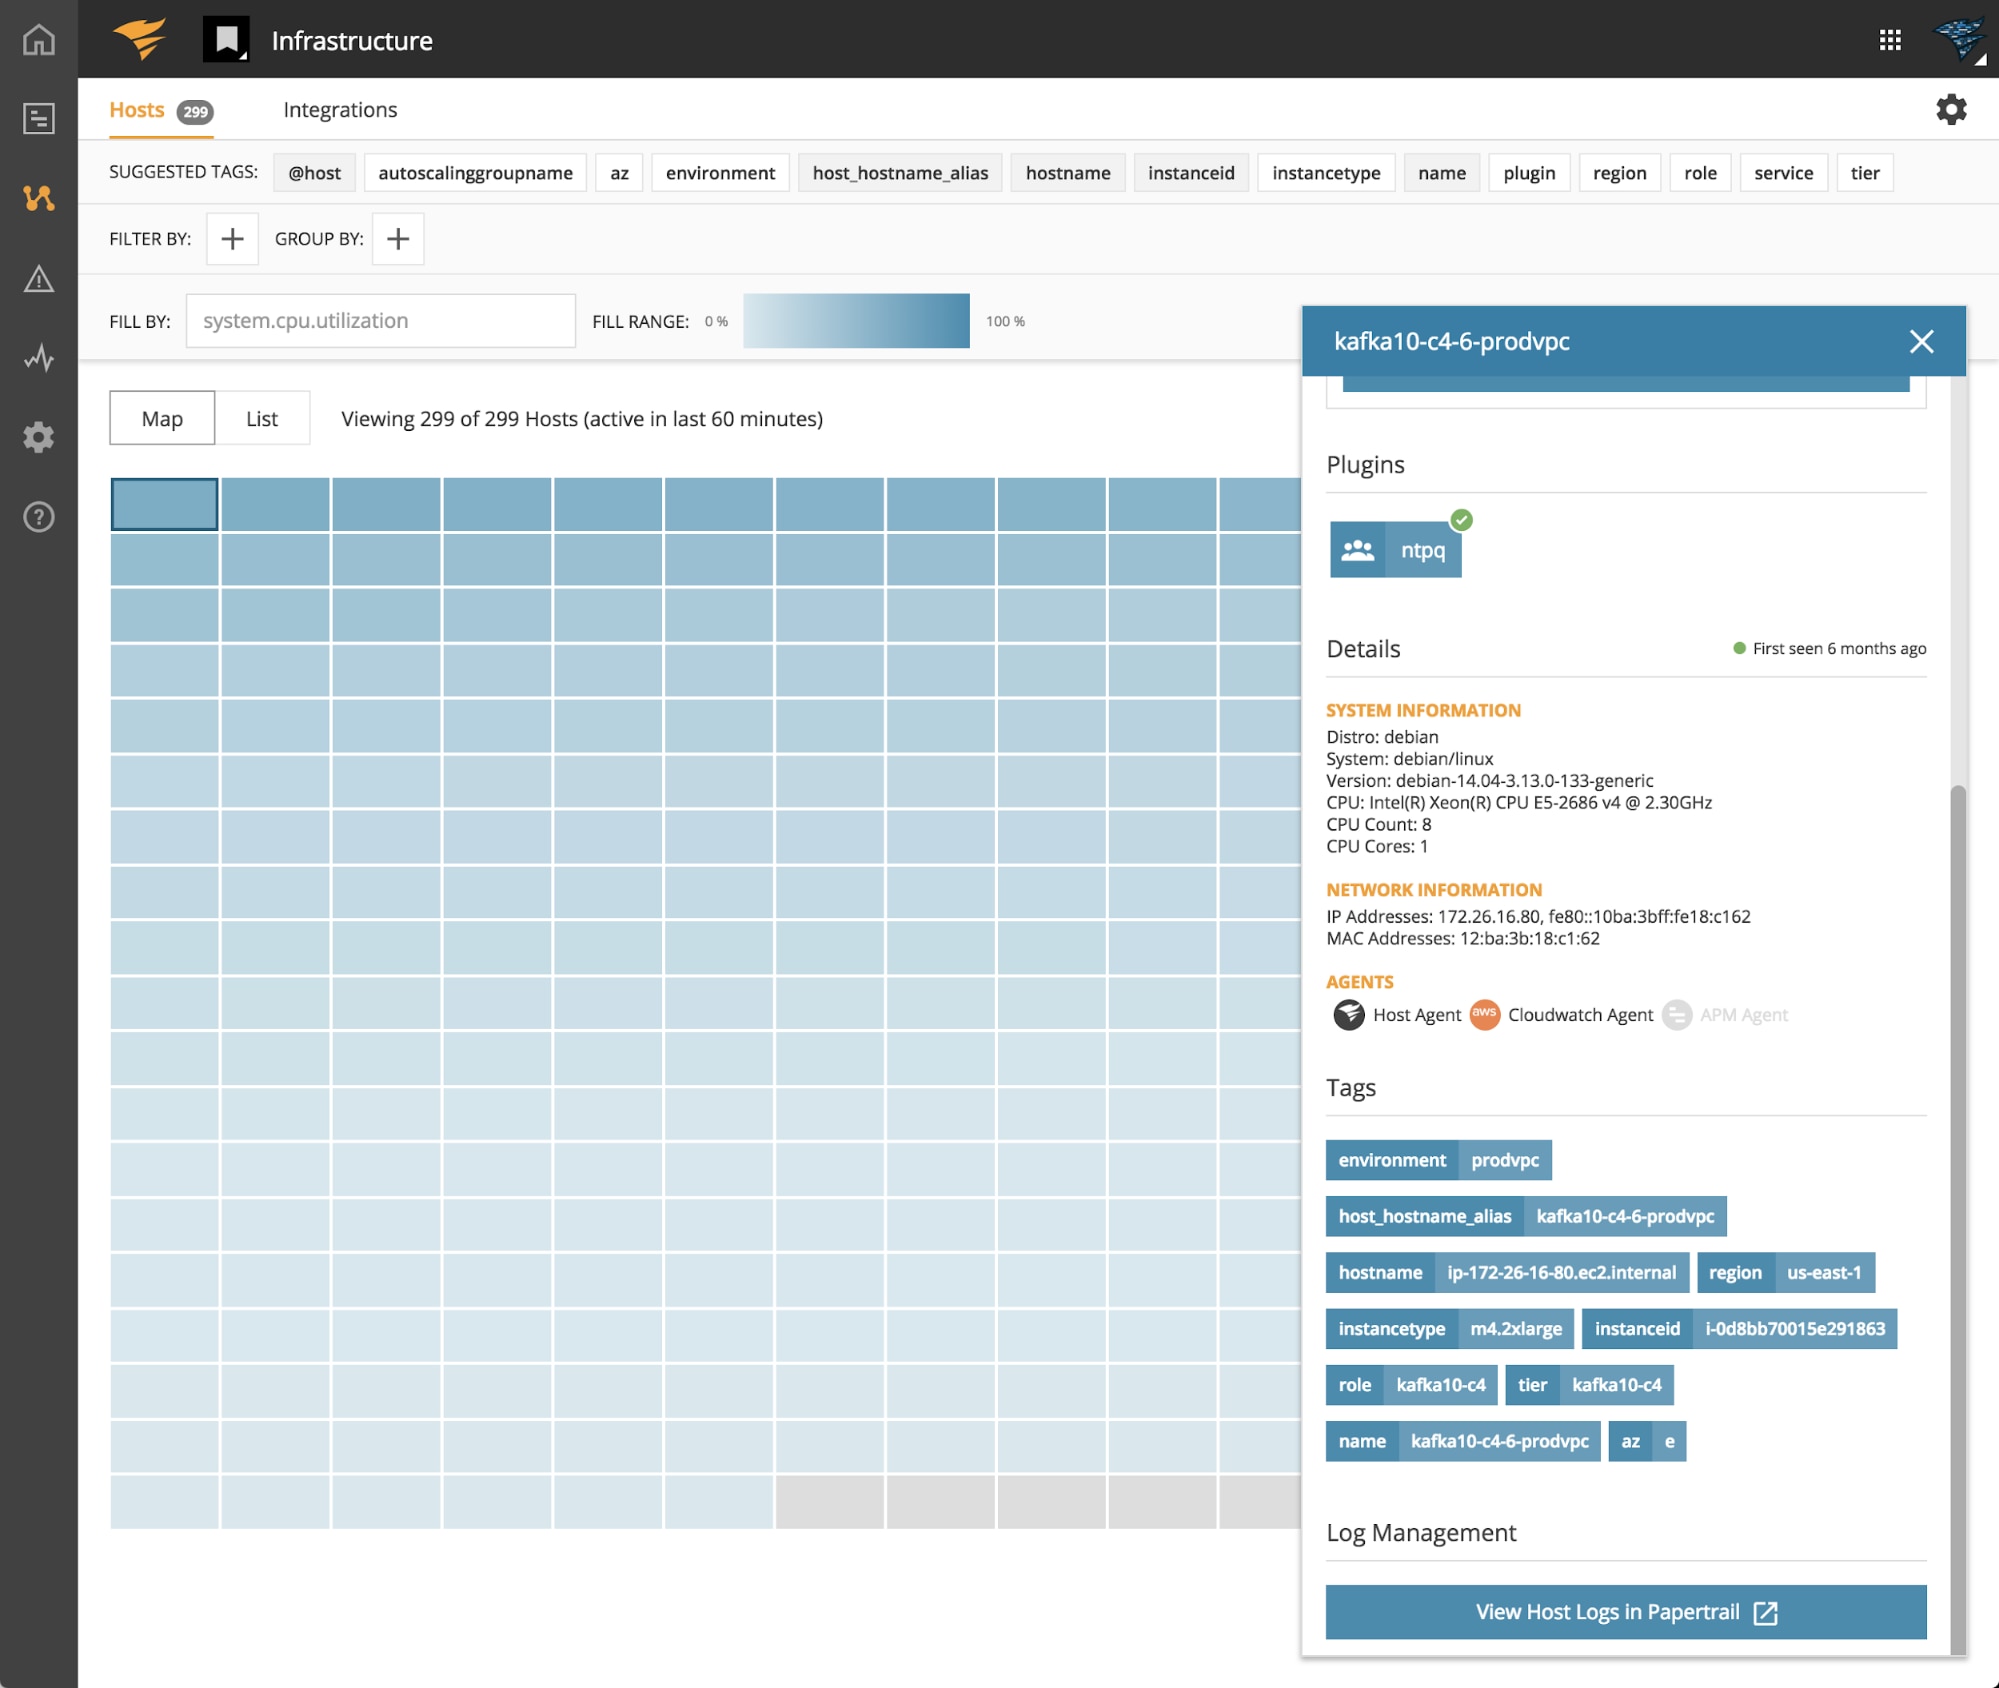
Clicking on the Papertrail link on the Host Details card will open up Papertrail on a separate tab where you’ll immediately be able to see the logs from that host.

Note: You’ll need to log in to Papertrail if you do not have an active, authenticated Papertrail session.

Figure 4: Event Viewer in Papertrail where you can see the logs from the selected host in AppOptics

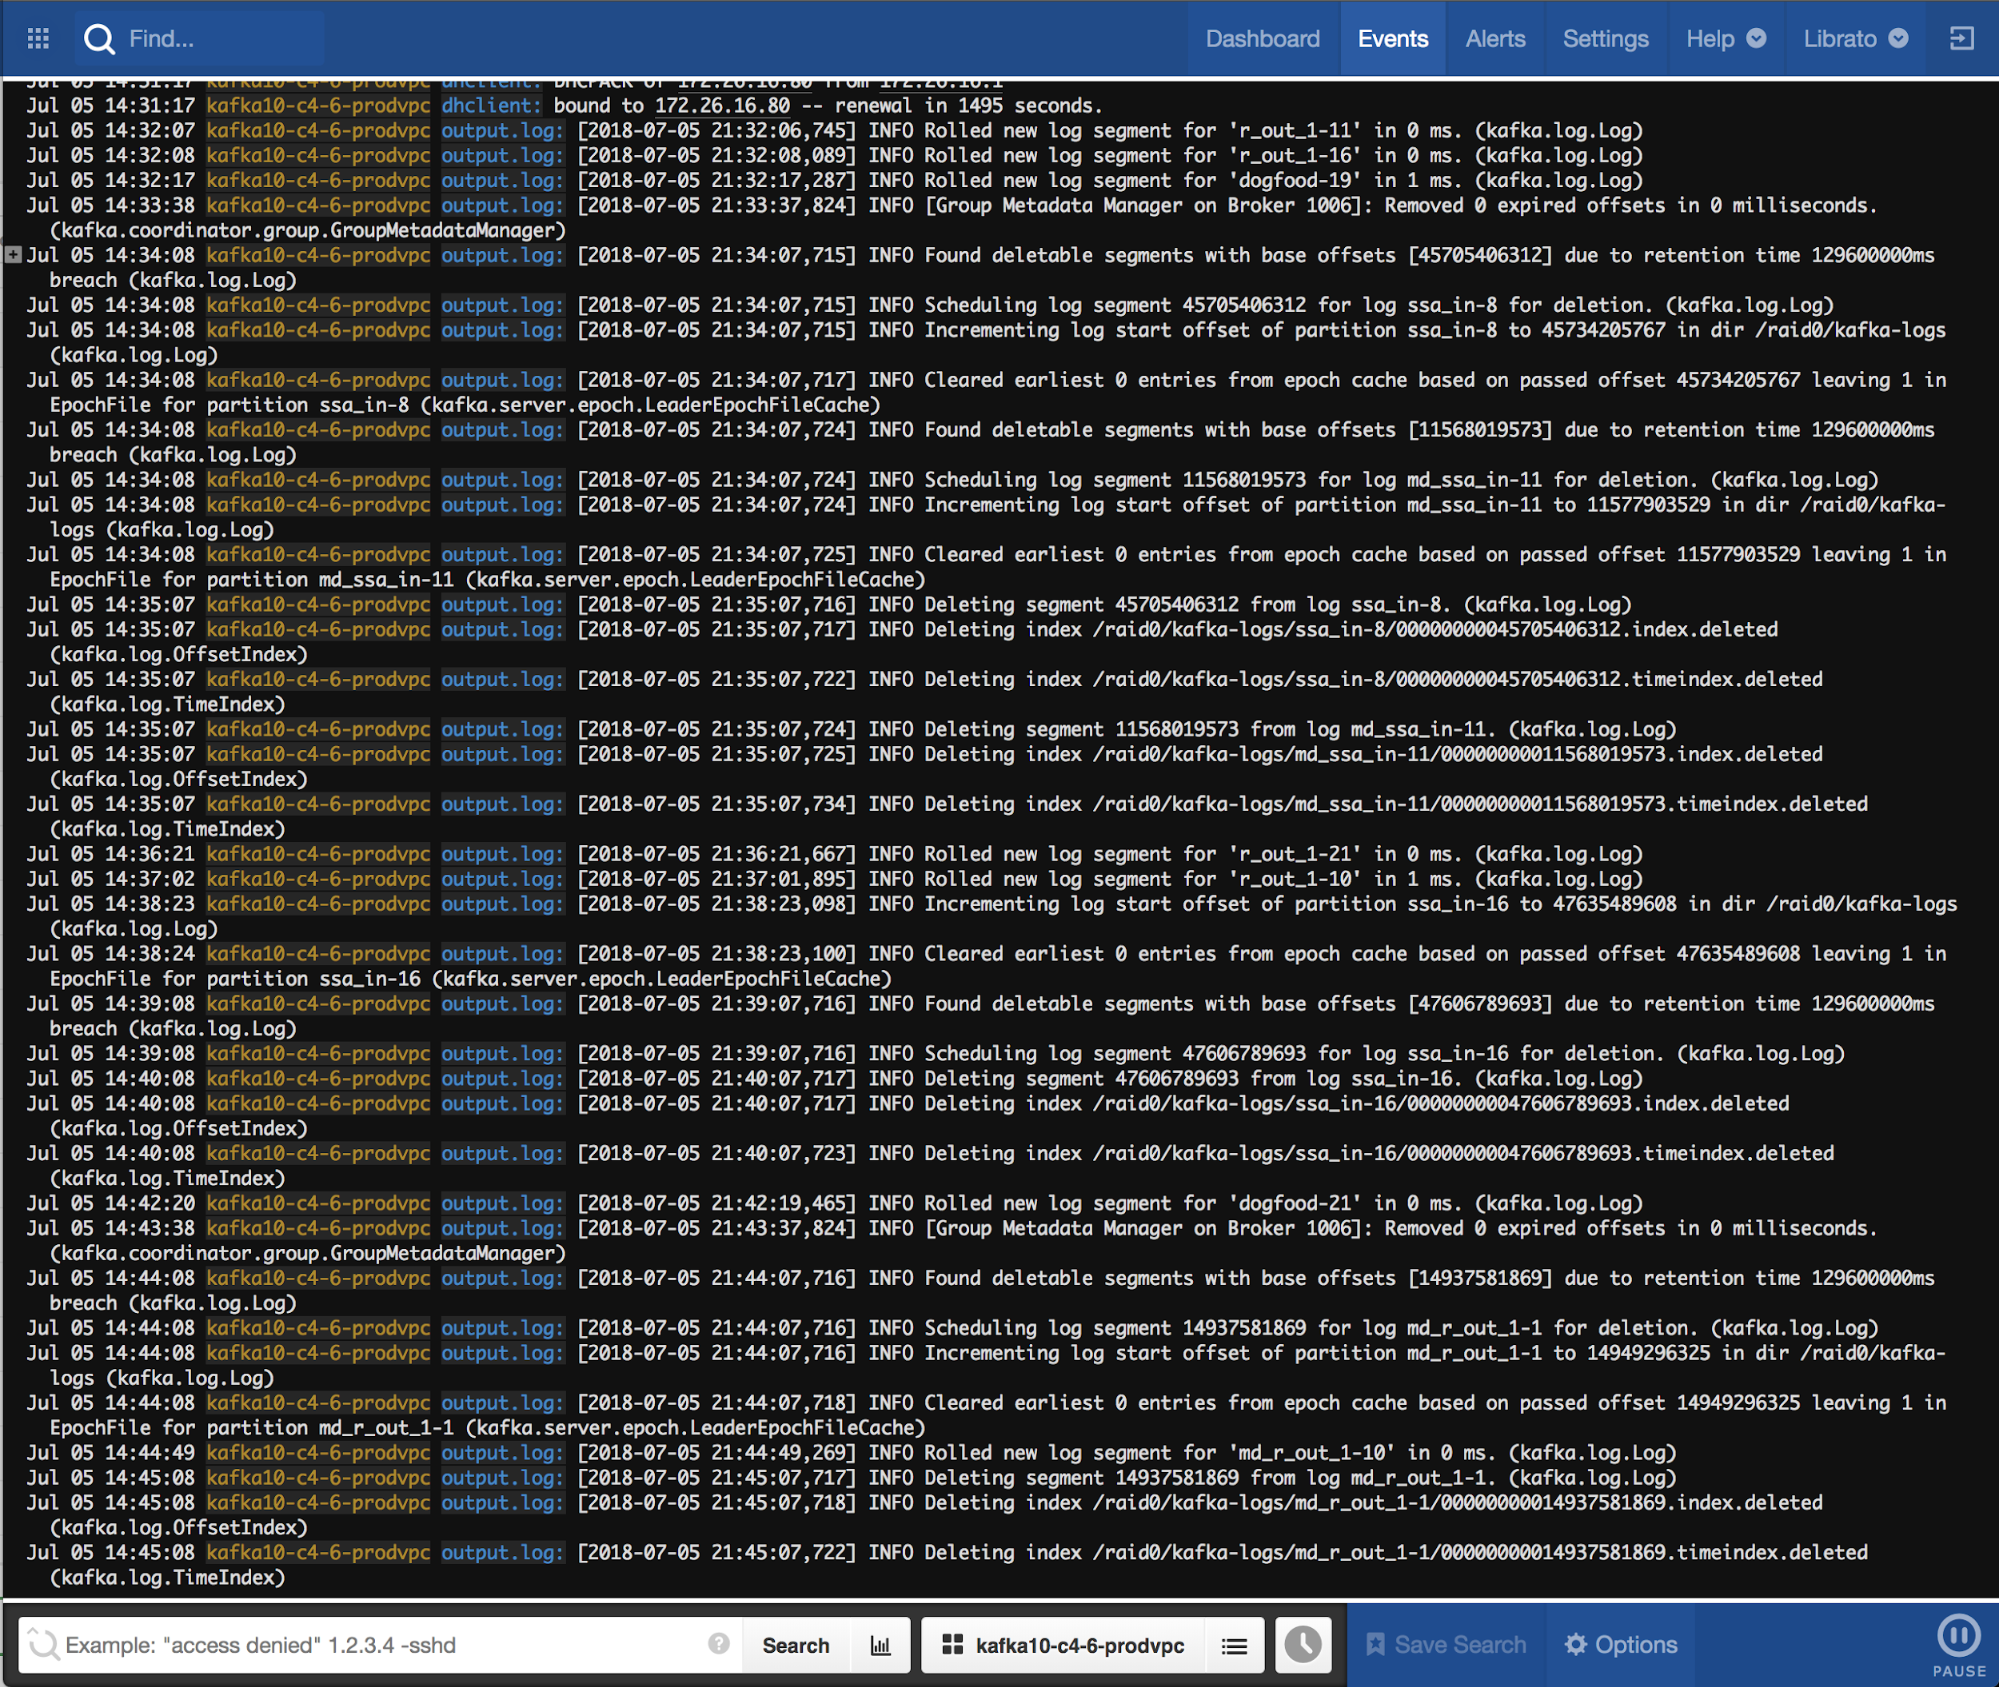
Now, you can browse through the server logs and find information that will provide more insights into what’s happening on that server.

Trailing in Action

Let’s say I have instrumented my application services using AppOptics APM agents. Using the host map, I can visualize hosts running these services and use the service error counts metric to see which hosts are encountering errors.

Figure 5: AppOptics Host Map where hosts are grouped by ‘service’ and ‘trace.service.host.errors.’ APM metric is used to color the hosts based on encountered error counts.

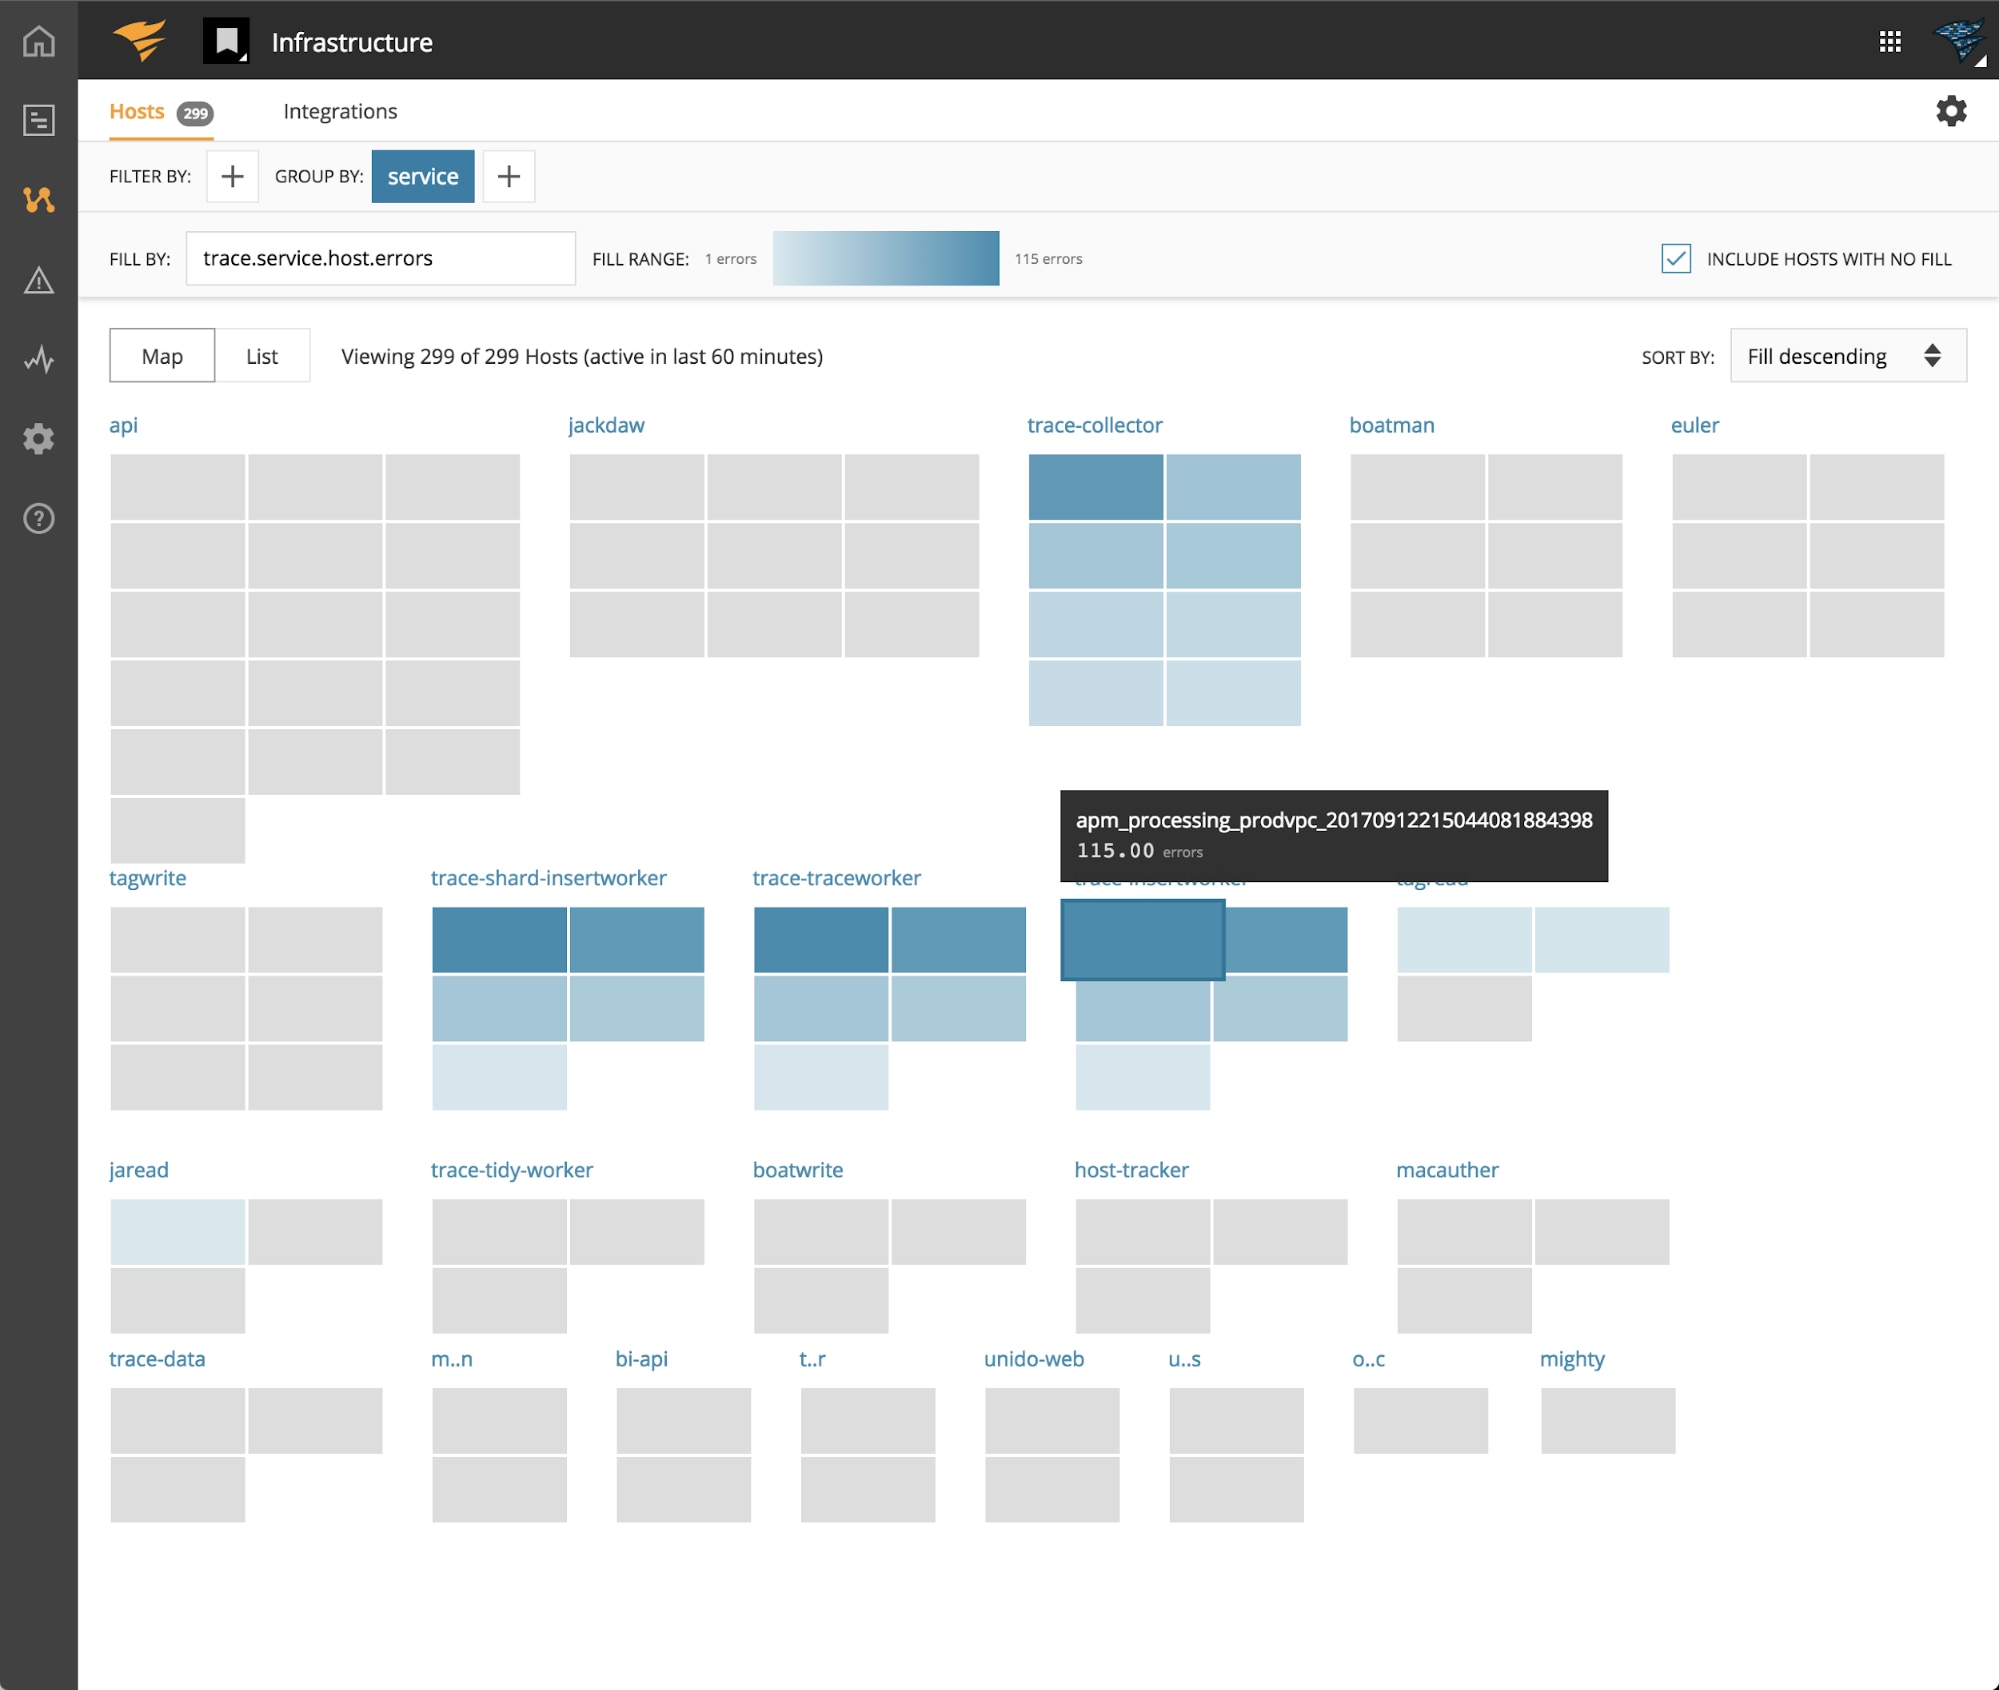
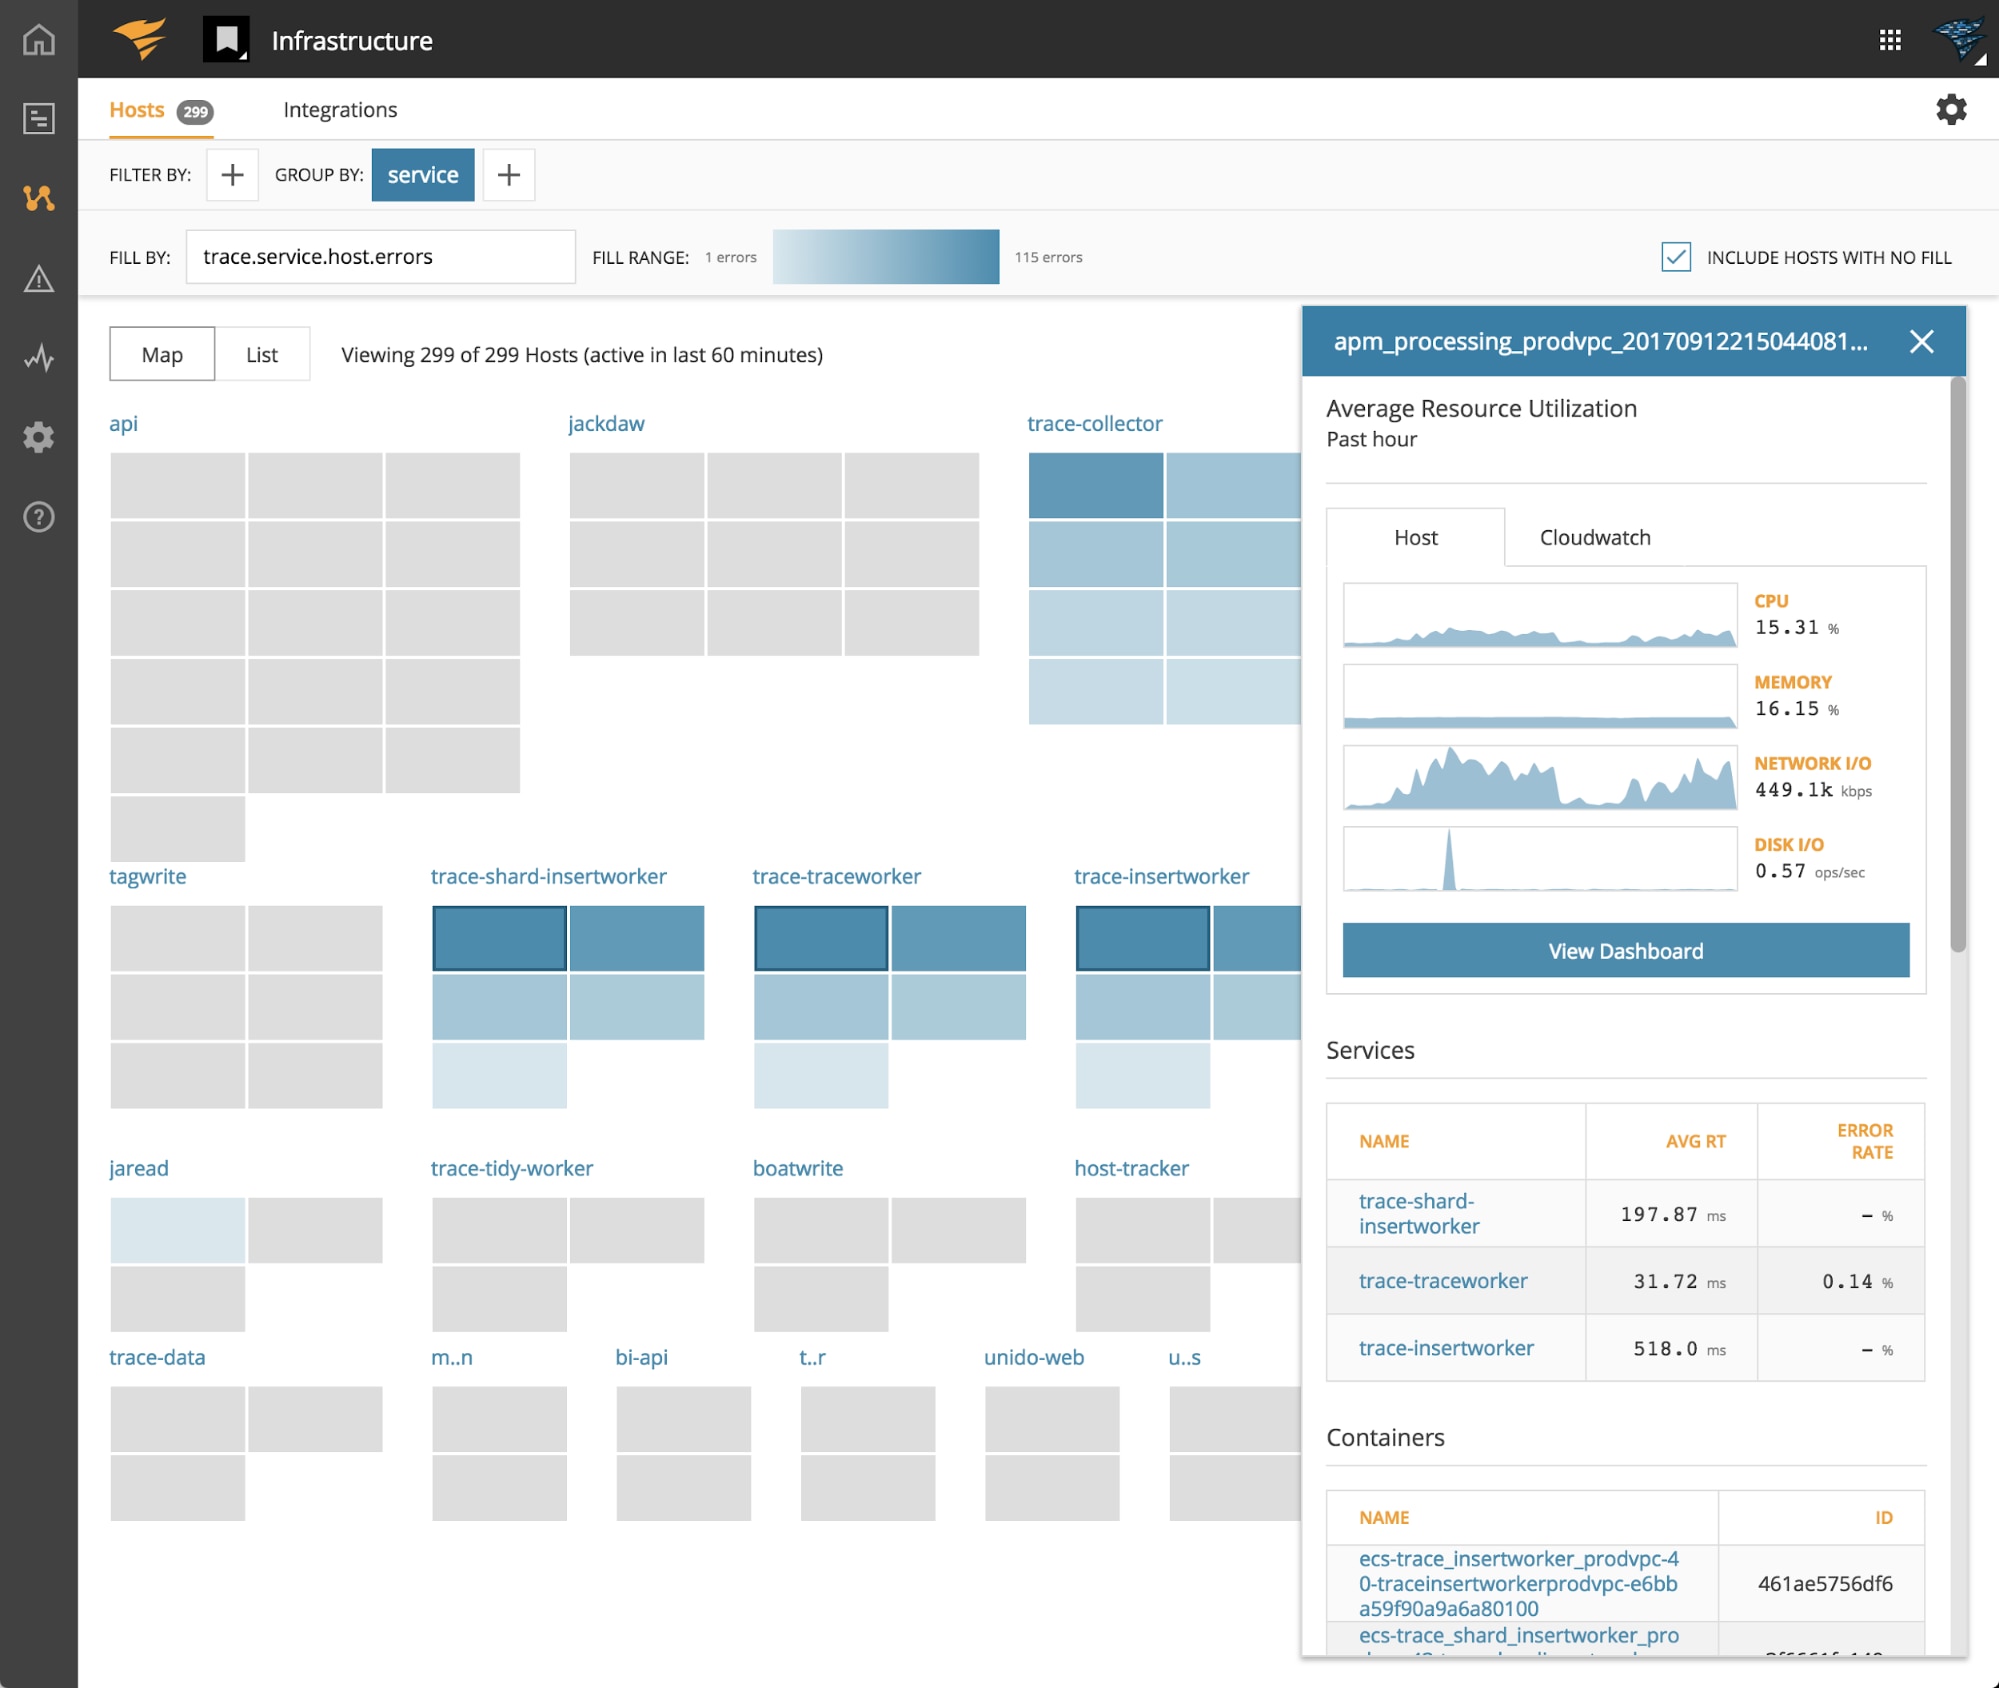
I can see that there are few hosts where a good number of errors have been detected. I can open up the hosts card and do the following:

  1. Check my system resource utilization for that host
  2. Trail that host’s logs by opening it up in Papertrail
Figure 6: This is a powerful view that correlates APM metrics to Infrastructure KPIs, and allows you to trail into Papertrail to view host logs

With AppOptics and Papertrail integration you can start to correlate APM metrics to Infrastructure KPIs and trail down into individual host logs. You can have an easy, yet full observability into how your application is running on your infrastructure.

Figure 7: Trailing server logs from AppOptics to Papertail – In Action!

Go ahead and give it a try! Happy trailing!

AppOptics: Sign up for a 14-day free trial today.

Papertrail: Sign up for a free account today.

Related articles

© 2024 SolarWinds Worldwide, LLC. All rights reserved.