We’re excited to announce the new, revamped infrastructure view for the AppOptics solution! The new hosts view provides the ability to group and filter your hosts by tags. This means you can freely slice-and-dice how you want to visualize your hosts on AppOptics.
The KPIs from both the host agent and CloudWatch are available for all hosts, and you can use them to sort the hosts. Coupled with flexible grouping and filtering mechanism for hosts, it is easy to identify outlier hosts that may be experiencing resource utilization issues.
Here are some of the highlights:
- Group and filter hosts based on tags
- See KPIs from both the host agent and, for AWS users, CloudWatch
- See more host details including system information, network information, and tags
- See container(s) running on the host
- See service(s) running on the host
Find hosts easily
Looking for a particular host? Use the @host tag alias filter to easily search for the host.
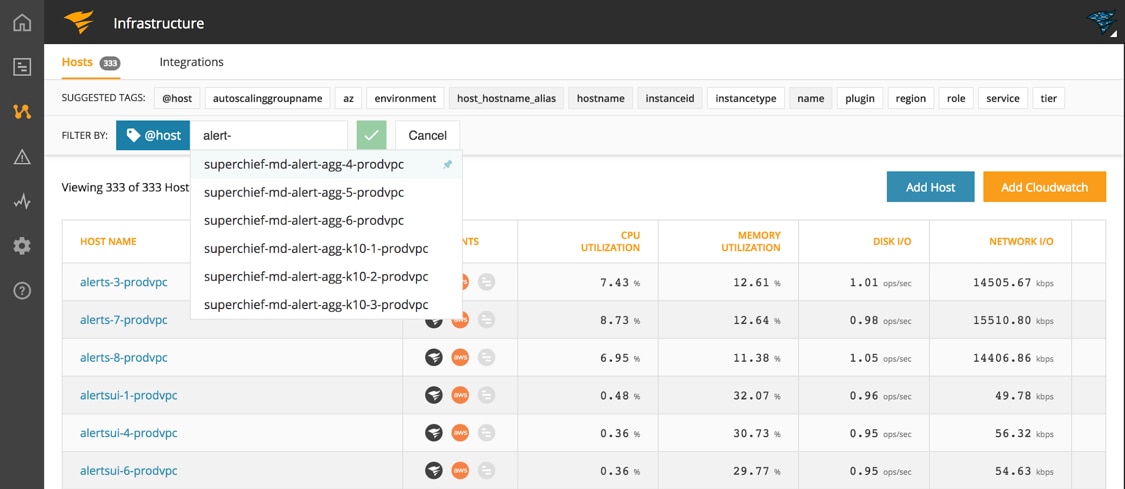
Group and Filter by Tags
Do you have hosts running on AWS? Use the host view to group the hosts by region and instancetype tag.

You can expand each group to see all the hosts in that group and sort on the KPI columns to easily see which hosts are incurring high resource utilizations.
Do you want to group the hosts by the plugin? Use the plugin tag.

Do you want to group the hosts by the APM service it’s running? Use the service tag.

Really… you can slice-and-dice it however you want!
Monitor group of hosts
Clicking on any of the host groups will open up the host group card. In this card, you’ll find collective information about the hosts in that group.
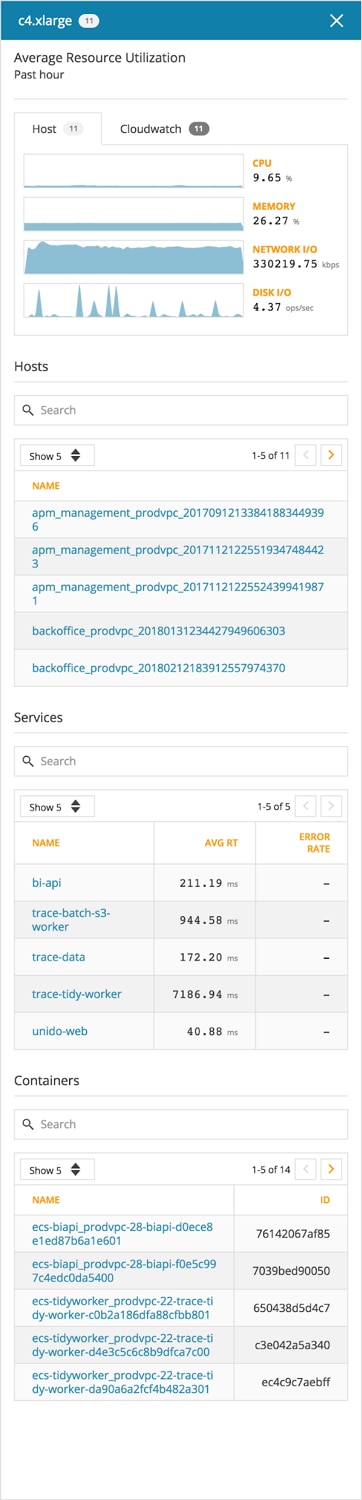
It’ll show you the average KPIs across all hosts in that group. You’ll see a holistic view of all hosts, services, and containers running in the group. (Clicking on the host will open up the host details card. Clicking on the service will open up the service card. Clicking on the container will open up the container card.)
Deep dive on a single host
Clicking on any of the hosts in the host view will open a host details card. In this card, you’ll find a wealth of information about that host.
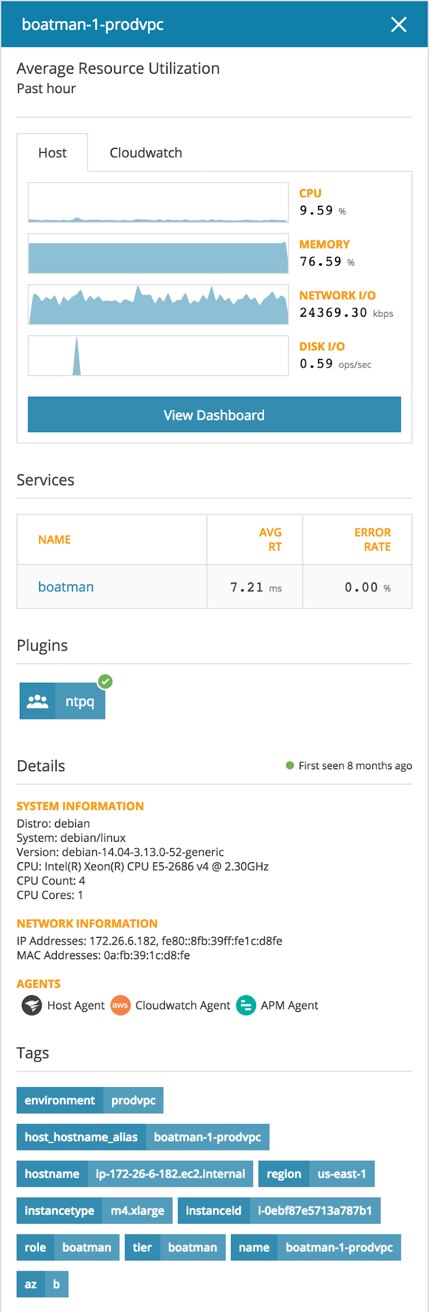
The host details card will show you
- KPIs coming from the host agent and/or CloudWatch
- List of services running on the selected host
- List of containers running on the selected host
- List of plugins running on the selected host
- System information
- Network information
- Agent indicator
- Tags
APM data in context with your infrastructure
When you click on the service running on the host, it’ll open up the service card.

You can quickly see how your service is performing by looking at the KPIs. If you want to see more details about the service, you can jump straight onto the APM Service Overview page from the card.
The tight integration with APM interfaces in the AppOptics solution allows you to easily correlate and associate infrastructure KPIs with APM KPIs, and easily identify the root cause of performance issues you may be experiencing.
Tip: Try using the service tag to group hosts by any services running APM agents.
You can also see all the hosts and/or containers running this service directly from the service card.
See your containers too
When you click on the container running on the host, it’ll open up the container card.
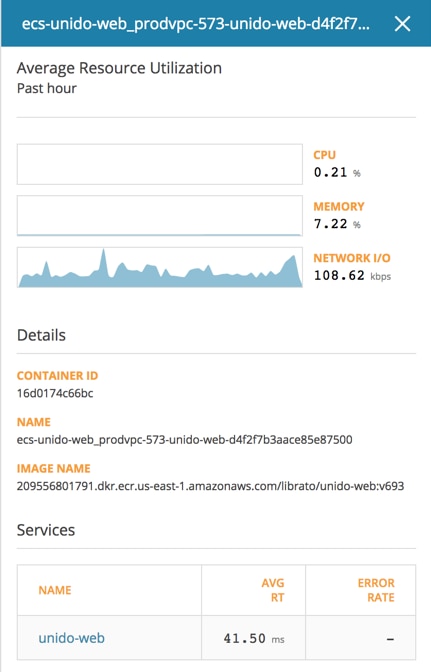
You can see the container KPIs (note: you must be running the Docker plugin on the parent host) as well as container details such as container ID, name, and image name.
It’ll also list out the services (typically just a single service) running on the container. Clicking on the service will open up the service card.
More to Come…
As you can see, we focused on providing flexibility on monitoring hosts along with the information necessary to perform deeper analysis.
But we’re not done yet! We have many more exciting features planned for the host view that’ll provide even more flexibility and customization. Stay tuned!