 Note: This article was originally published on Librato, which has since been merged with SolarWinds®AppOptics™. Explore how you can analyze and tune java performance with AppOptics.
JMXTrans is the sixth installment to our Collector Highlight Series. We started the series with an overview of the patterns employed by the various data collection tools available, with additional posts including StatsD, collectd, Heka, and Graphios.
What Is It?
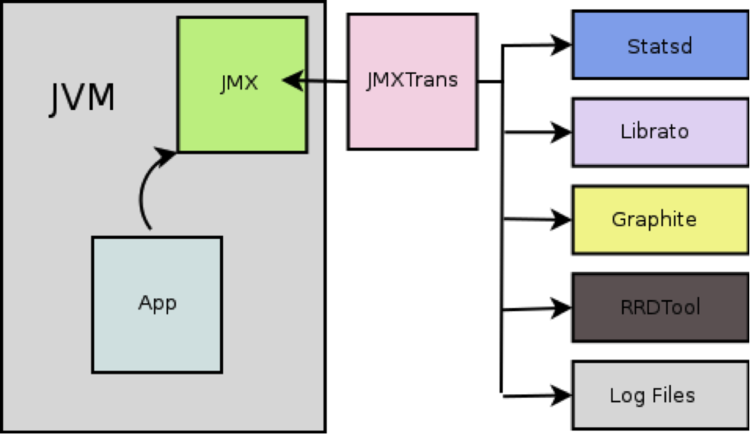
In its own words, JMXTrans is: “the missing connector between speaking to a JVM via JMX on one end and whatever logging/monitoring/graphing package that you can dream up on the other”. If you aren’t familiar, Java Management Extensions (JMX) is the formally provided channel for exporting metrics from applications running inside the JVM to other processes. JMXTrans acts as a glue-layer between an application that exposes data via JMX and various monitoring and metrics tools that import and make use of that data.
JMXTrans is a great fit for you if you need to export metrics from any sort of JVM Application into your Librato account.
How Does it Work?
JMXTrans follows the centralized polling pattern. It periodically polls a running JMX process, grabbing the metrics you’re interested in and emitting them, via a series of output writers, to your monitoring system. Because it polls JMX, it obviously requires that JMX be enabled on the JVM that’s running your application.

You can enable JMX by specifying several options to the JVM when you start it. The simplest (and also most insecure) configuration consists of these four options:
- Djava.rmi.server.hostname= <IP Address>
- Dcom.sun.management.jmxremote.rmi.port= <PORT>
- Dcom.sun.management.jmxremote.ssl=false
- Dcom.sun.management.jmxremote.authenticate=false
Once enabled, the JMX Service will be available on the IP and port that you specify. Many different tools can interact with a running JMX service, including JMXTrans, jvisualvm, and JConsole.
Because the specific metrics available depend on what your application exports, you’ll need to use a tool like JConsole to explore the JMX service. We’re using it in the screenshot below to explore some of the metrics exported by an Apache Cassandra server with JMX enabled. JConsole is included with the JDK, so you shouldn’t need to download or install anything to get it running. Connect to a running JMX instance with:
| jconsole <IP>:<PORT> |

The names in this window will correspond to the metric names we’ll refer to later when we configure JMXTrans. The Hierarchal list in the left window pane corresponds to JMXTran’s obj configuration attribute, while those on the right correspond to attr names.
Even if your application doesn’t export any metrics at all, JMX will still emit helpful memory-management, cpu, and thread-usage metrics from the JVM, which are difficult to obtain otherwise.


Once you have JMX enabled for the application you want to monitor, and you’ve decided on the metrics you’re interested in graphing, you’re ready to get JMXTrans installed.
How Do I Install It?
JMXTrans is hosted on Github. You can download prepackaged versions for RedHat or Debian systems, or a source code zip file from the downloads page. The RedHat and Debian packages both ship with an init script, which makes it easy to start or stop the JMXTrans service on those systems, and a config file in /etc which you can use to modify the behavior of the JMXTrans daemon itself (including its polling interval).
The JMXTrans service reads from configuration files placed in /var/lib/JMXTrans. Here’s an example of a JSON config for JMXTrans that’ll capture a couple of Cassandra metrics that refer to compactions on a single Cassandra node, and send them to Librato.
{
  "servers" : [ {
    "host" : "192.168.50.100",
    "port" : "7199",
    "queries" : [ {
      "obj" : "org.apache.cassandra.db:type=CompactionManager,*",
      "attr" : [ "PendingTasks", "TotalBytesCompacted"],
      "outputWriters" : [ {
        "@class" : "com.googlecode.jmxtrans.model.output.LibratoWriter",
        "settings" : {
            "username" : "dave@librato.com",
            "token" : "cd4b234567545cb2453243qcbt546dbd43d5371"
        }
      } ]
    } ]
  } ]
}
JMXTrans uses output writers to emit metric data to a specific monitoring system. In the example above, we’re using the Librato output writer but many are available to push metrics to systems like Statsd, Graphite, RRDTool, and flat-files. Since the outputWriters attribute is a JSON array, you can specify more than one output writer for a given series of metrics, and JMXTrans will emit to all of them simultaneously.
JMXTrans will also emit stack-traces and error logs into a log file in /var/log/jmxtrans. Check this file if you don’t begin to see metrics appear in a few seconds.


Hints, Trade-offs, and Gotchas
At the time of this writing, the JMXTrans project was in the process of moving their build process from ant to maven, and, as a result, the Librato output writer was not included in the packaged versions of JMXTrans. If you’re installing JMXTrans from one of the pre-packaged distributions, and the Librato writer is not available, you can work around it by cloning this JMXTrans repository, and building and installing it manually with:
maven clean install -Pdpkg
JMXTrans All the Javas
JMXTrans is a great tool that’s also easy to install. At Librato, we use it to monitor our Java-stack, including our Cassandra systems, as well as the custom services we’ve written in Java.
