A comprehensive set of turnkey infrastructure integrations

Including dozens of AWS and Azure services, web, database, network, containers, orchestrations like Docker and Kubernetes, and more.

START FREE TRIAL

Complete visibility into the health and performance of applications and their underlying infrastructure

Quickly pinpoint the root cause of performance issues across the stack, down to a poor-performing line of code

START FREE TRIAL

Custom metrics and analytics

Analyze custom infrastructure, application, and business metrics

View Custom Metrics Monitoring Info
Powerful API that makes it easy to collect and create any custom metric

Achieve ultimate visibility and enhanced troubleshooting with synthetic and real user monitoring

START FREE TRIAL

Free APM Software

Catch bugs early on, and gain full visibility and insights into the applications you’re developing

View Product Info
Free, full-function APM tool for testing and troubleshooting application performance before moving into production

Dev Edition includes five traces per minute, 100 metrics, three hosts, and six containers

GET FREE TOOL

Log Management and Analytics powered by SolarWinds Loggly

Integrated, cost-effective, hosted, and scalable full-stack, multi-source log management

View Log Management and Analytics Info
Collect, search, and analyze log data in addition to your metrics and traces to quickly pinpoint application performance problems

Reduce mean time to resolution (MTTR) by quickly jumping from a trace or host view into the relevant logs to accelerate troubleshooting

START FRE TRAIL

Digital Experience Monitoring Powered by SolarWinds Pingdom

Make your websites faster and more reliable with easy-to-use web performance and digital experience monitoring

View Digital Experience Monitoring Info
Add client-side web application performance monitoring. Provide maximum observability by adding the user’s perspective.

Achieve ultimate visibility and enhanced troubleshooting with synthetic and real user monitoring

START FREE TRIAL

I’m a command line kind of guy. You can call me a hipster, an elitist, or even a vim zealot, but I tend to prefer doing things with a keyboard instead of a mouse. I just think keystrokes are a faster and more precise way to make a computer do stuff. There is usually a little (ok, or a lot of) extra learning required to figure out what the commands are for a particular tool, but once you do, speed and efficiency are yours.

This is why I’m excited to announce the AppOptics Global Search feature with—drum roll—key bindings! (I’m told having a way to search all of the things in AppOptics will be useful for mouse users as well.)

How does it work? Well, just like in the World’s Greatest Text Editor Ever, if you want to search for something, you type ‘/’. (Or, if you must, you can click the magnifying glass in the upper left corner.)


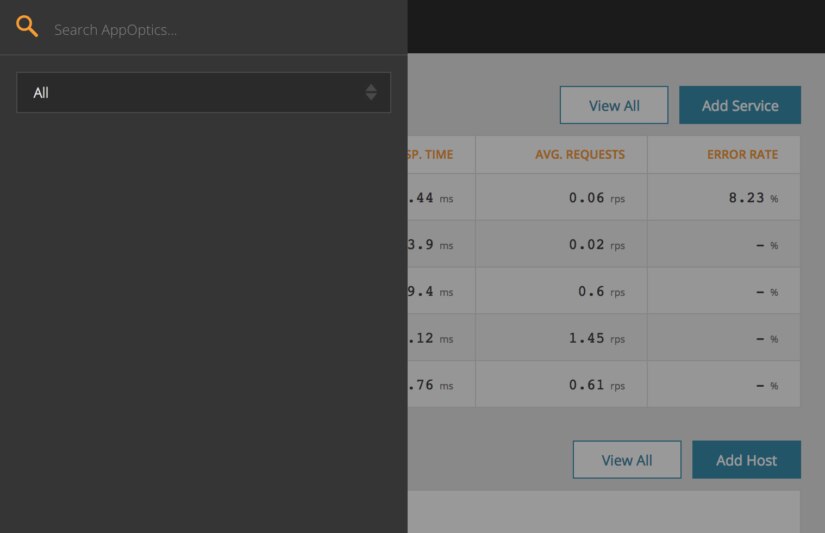
When you do that, a side panel pops out and invites you to search for something:


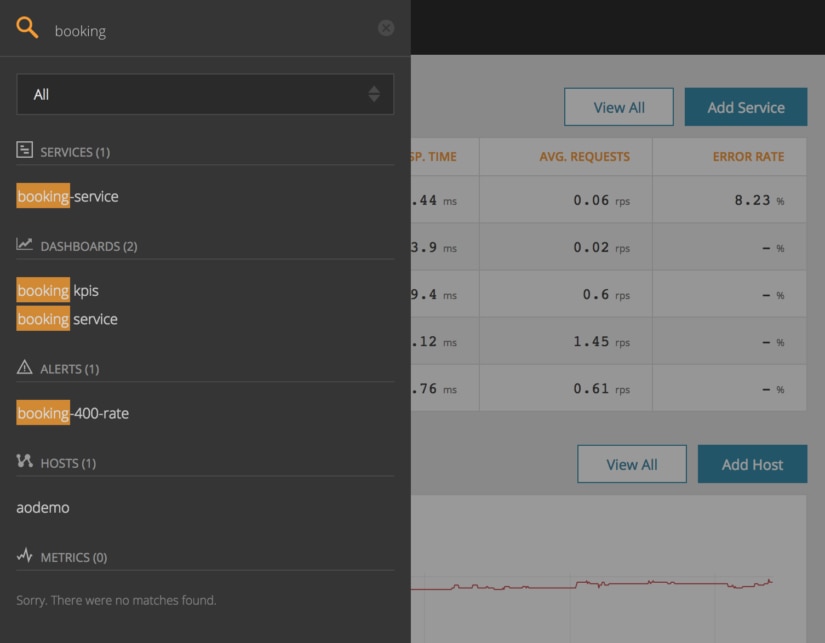
From there you can start typing a search term and see services, dashboards, alerts, hosts, and metrics that match:


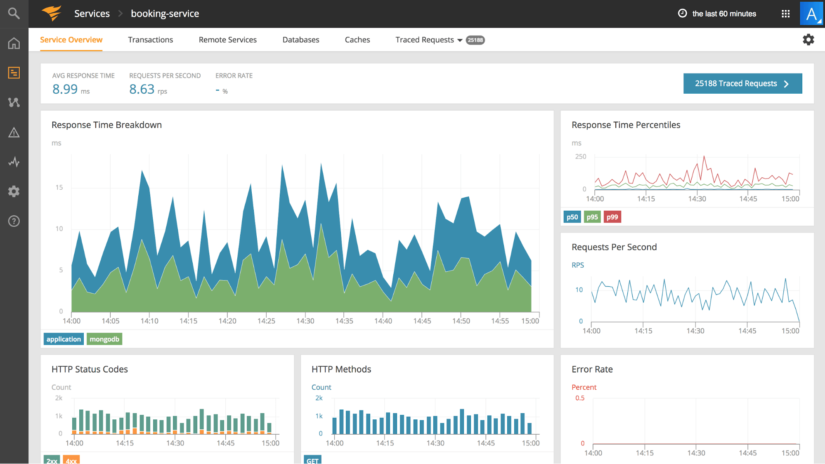
Next, you can select the search result that strikes your fancy using the arrow keys and then hit enter to go there (yes, yes, you can also point and click if you prefer). For example, here’s the APM service overview page:


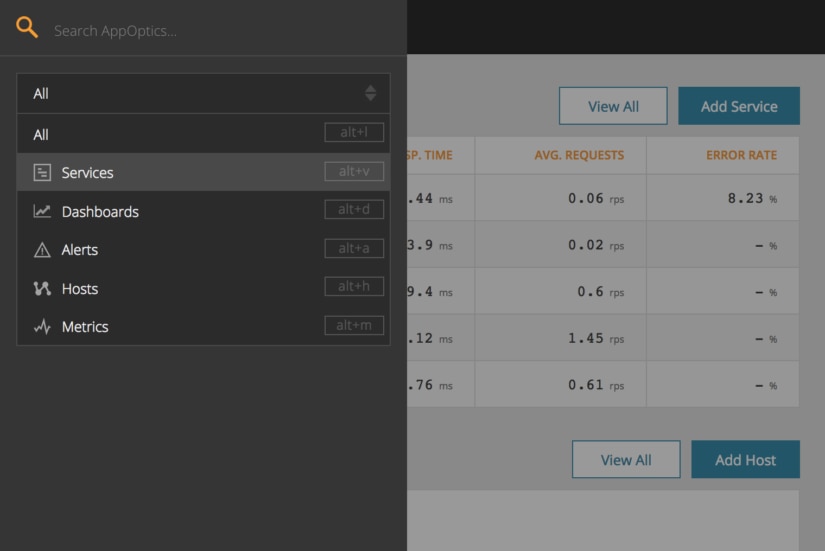
There’s also a dropdown in the side panel that lets you search for only one type of thing at a time. For example, “services:”

Discriminating users will access these with the associated shortcuts, like ‘alt+v’ for services.

Global Search makes AppOptics navigation quick and easy, but there’s another benefit as well: context. We have had search functionality within the various sections of AppOptics since we launched but, with Global Search, users can now see everything related to “foo” in one place:

  • The foo APM service (“foo-service”)
  • The hosts where foo is deployed (“foobox1”, “foobox2”)
  • The metrics foo is producing (“api.measures.foo.bar”)
  • The dashboard tracking foo’s metrics (“Foo Fighting Dashboard”)
  • The alerts that will go off when the foo hits the fan (“foo-error_rate-high”)

With all these results in one list, you can quickly see everything that AppOptics knows about foo and decide where you want to go next to learn more.

Happy searching and (keyboard) navigating!

Related articles

© 2024 SolarWinds Worldwide, LLC. All rights reserved.