
Web servers are among the most important components in modern IT infrastructures. They host the websites, web services, and web applications that we use on a daily basis. Social networking, media streaming, software as a service (SaaS), and other activities wouldn’t be possible without the use of web servers. And with the cloud computing craze moving more services online, web servers, and web server monitoring as a result, are only becoming more important.
What Are Web Servers?
Web servers are software services that serve resources over the World Wide Web. These resources can be anything from HTML documents to music files to JavaScript files. Devices that are networked to the server (clients) request these resources, and the server delivers them. This basic interaction defines every connection made between your computer and the websites you visit.
Web servers also perform other services, such as serving dynamically generated content to activating as a forward or reverse proxy. Dynamic content is used in websites where the content changes based on the request. Proxies are used to redirect requests from one web server to another based on a set of rules. At the core of each of these transactions is the Hypertext Transfer Protocol (or HTTP), a nearly 30-year-old protocol that defines how web traffic is structured and handled.
Why is Web Server Monitoring Important?
Web servers provide a number of important functions. This means there’s much to keep track of, including:
- Connections to clients and other servers on the network
- Requests for host resources such as CPU, RAM, and disk access
- Traffic being transferred to and from the server at any given time
- Availability of other web servers for proxying requests
Since web servers handle user requests for content, their performance has an immediate and noticeable impact on the user experience. If your web servers are slow, users will abandon your service for a competitor’s. This applies to large sites as well; the BBC found that for every one-second increase in page load time, 10% of their users left. Additionally, monitoring will alert you to any errors or failures that could result in downtime.
Monitoring has a second benefit for IT environments: automation. High-availability environments often optimize throughput with load balancing, where requests are delegated across multiple web servers rather than to a single one. A separate load balancing service receives incoming requests, checks the availability of the web servers located behind it, and proxies the request to an available server. To do this, the load balancer must be aware of each web server’s current load and its availability to handle new requests.
Lastly, monitoring helps track the popularity and growth of websites and web applications. Traffic and connection metrics offer direct insight into site activity, including the number of active users and the duration of each session. This data is particularly valuable in a world where more users are using ad blockers, preventing tracking through JavaScript. This data can help you develop plans for scaling your website, optimizing your application, or deploying other services to support the increased demand.
The Basics of Web Server Monitoring
There are dozens of web servers, but the two most popular are Apache and NGINX.
Apache
The Apache HTTP Server (also called httpd or Apache) is the world’s most popular web server. It was created in 1995 and quickly grew in popularity. As of October 2018, it’s used to host over 45% of all websites.
As an open-source project, Apache is both freely available and widely customizable. Its architecture has a base core with additional features added through modules. This model—along with an active development community and extensive list of supported modules—makes Apache extremely versatile. Apache’s biggest challenge is its scalability. Originally, Apache spawned a new thread for each new connection. This allowed it to respond quickly to incoming requests but made it impossible to handle a large number of requests at once. Newer versions are much more effective at handling heavy traffic but may need additional tuning.
NGINX
Despite only being released in 2004, NGINX is one of the top competitors to Apache. Its popularity has increased steadily since its release, and it now stands as the world’s second most popular web server. Over half of the world’s top 1,000 websites use NGINX.
What differentiates NGINX is its design philosophy. NGINX was built for performance, specifically to address the C10K problem (handling ten thousand simultaneous connections). It creates a fixed number of threads, each of which can process multiple connections asynchronously. This helps it perform much faster and with a lower memory requirement than older web servers.
Because of its performance benefits, NGINX is often used as a lightweight proxy for other web servers. Instead of hosting content, NGINX takes incoming requests and redirects them to other servers. It also works well as a caching service, hosting content from other servers to reduce the volume of traffic going to those servers.
Cloud Platform Web Servers
Cloud platforms like Amazon Web Services (AWS) and Netlify are increasingly being used to serve web content. They are often recommended for serving static sites like those built with Jekyll and Hugo. For example, services like Amazon Simple Storage Service (S3) can be used to host static websites. Static websites consist of content that doesn’t change between requests, whereas content generated using PHP, Python, and other web languages can change. Since static websites consist of just static resources, S3 can deliver them to users exactly as they are. The benefit is that hosting a static site is significantly less expensive and resource-intensive than a dynamic site.
Both static and dynamic sites also benefit from content delivery networks (CDNs), such as Amazon CloudFront. CDNs function similarly to proxies, but on a much larger scale. Instead of accessing the web server directly, users access the CDN, which forwards the request to the web server (known as the origin server). CDNs cache content from the origin server in multiple locations around the world, reducing load and delivery times to end users.
Collecting Web Server Metrics
Both Apache and NGINX report internal metrics via an HTML page. Apache has the mod_status module, and NGINX has the ngx_http_stub_status_module module. The following image shows an example of Apache’s status page:
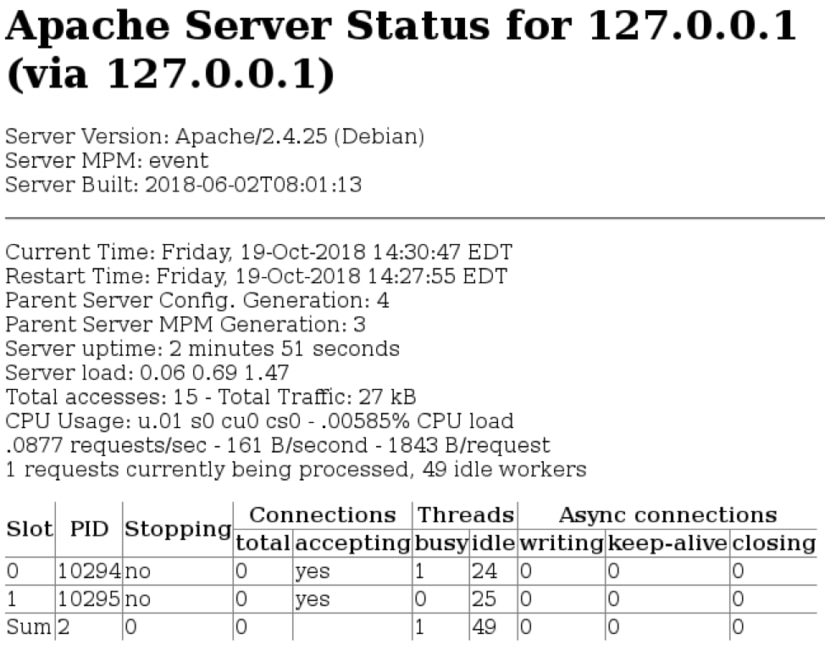
Both modules also provide machine-readable versions of these pages, which are easier for monitoring tools such as SolarWinds® AppOptics™ to parse. These tools can periodically retrieve these statistics in order to track server state, load, and available capacity. They also highlight how server performance changes over time, helping you plan for changes in demand.
Analyzing Web Server Metrics
Web server metrics fall into two distinct categories: connection metrics and host metrics.
Connection Metrics
Every connection made to a web server results in transferring data transferred and generating responses. Metrics include:
- Request rate: The number of requests that the server receives over time. High request rates could indicate a recent increase in traffic.
- Response time: The time to send a response to a request. High response times could indicate problems with the web server, host, or website resources, and result in frustrated users.
- Response size: The amount of data delivered with each response (typically measured in bytes). Smaller responses use less network bandwidth and load faster for users, especially over limited and mobile connections.
- Active connections: The number of requests currently being fulfilled. Too many active connections can exhaust the host’s available network ports, preventing new users from connecting.
Host Metrics
Web servers run as a service on their host machine. They run continuously as a background process, waiting for incoming requests. Host metrics describe the impact of the web server on the host machine, and vice versa. Metrics include:
- Uptime: The length of time the server is active. Sudden drops in uptime could indicate an unplanned server reboot or outage.
- CPU usage: The amount of CPU time used by the web server. High CPU usage means the server is near capacity and will become less responsive.
- Memory usage: The amount of RAM used by the server. Excessive RAM usage will cause the server to use swap space, lowering performance. If RAM is exhausted, the server will crash.
- Cache: The amount of disk space used to cache pre-generated responses. Caching can lower response times by not having to generate a complete response on demand, but it may require significant amounts of disk space.
- Threads: The number of threads that the web server is using to handle requests. As each thread requires CPU time and RAM, too many threads can lead to poor performance or system instability. It could also be a sign that many asynchronous tasks are being starved while waiting on a shared resource.
Troubleshooting Using Web Server Metrics
No matter how resilient you make your infrastructure, web servers can fail. Whether they’re responding slowly to new requests or outright refusing connections, an unhealthy web server can have long-lasting consequences for your website and its users.
Let’s look at a website with a very big performance problem. In an attempt to support higher volumes of traffic, we reconfigured Apache’s event multi-processing module to support a larger number of active connections. But immediately after applying the new configuration, the number of active connections dropped by half. We know it’s not a problem with dynamic content, since we’re only hosting static content. Other applications on our infrastructure are responding as well, so it’s not a network or host problem. The problem must be with the web server itself.
To troubleshoot this issue, we used SolarWinds AppOptics to collect metrics directly from Apache. We enabled the Apache status reporting module for our website, as well as the Apache plugin in the AppOptics host agent. This allowed us to gather, analyze, and graph metrics for the entire server in near real-time.
Determining the Problem
We know that new connections are being denied, but we’re not sure to what extent. We’ll start by graphing out connection metrics over time, including the total number of requests and the total number of active connections. Our website runs on Apache, and by using the AppOptics host agent, we can easily collect and graph Apache monitoring metrics.
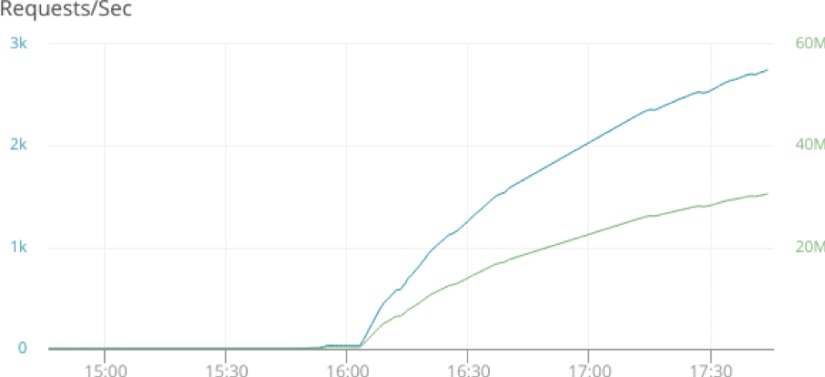
Although the number of active connections fell from about 500, we’re still seeing a steady increase in bytes transferred. What caused the drop off, and how is it that our request volume is increasing despite supporting fewer connections?
Identifying the Cause
Like any software service, web servers require resources to run. CPU and RAM are the two most commonly utilized resources, since each connection to the server requires a little bit of processing power and memory. Graphing CPU and RAM usage over time, we can see repeated increases in resource consumption at frequent intervals:
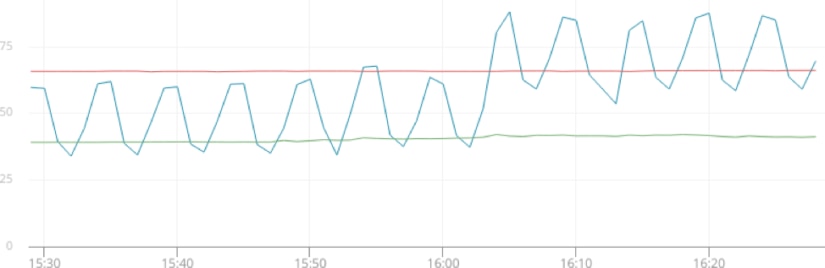
Interestingly, CPU usage never actually reaches 100%, so it’s probably not a resource overutilization issue. We need to look somewhere else.
Gathering Information
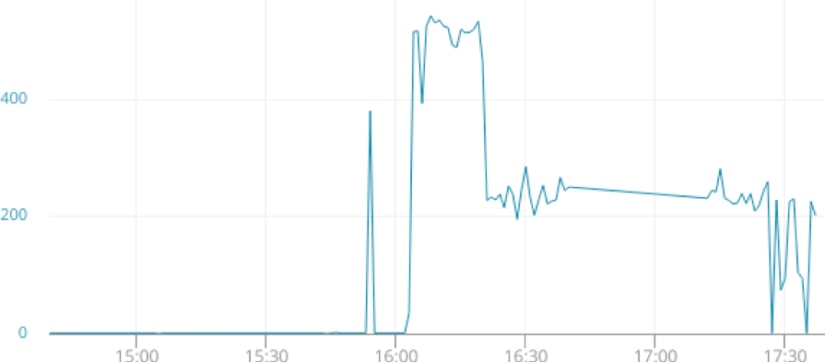
Before troubleshooting further, let’s get an exact count of the number of active connections:

We know that a lack of resources isn’t the problem, since we were able to sustain over twice as many connections after starting the server. The problem must be with the server’s configuration. Let’s look more closely at the configuration file for the event MPM module.
Resolving the Problem
The event MPM module handles each connection in a separate thread. The maximum number of threads is calculated by multiplying the ServerLimit directive (the total number of processes Apache can spawn) by the ThreadsPerChild directive (the number of threads per process). These are defined in the module’s configuration file located at /etc/apache2/mods-enabled/mpm_event.conf (on a Debian 9 server):
# mpm_event.conf
<IfModule mpm_event_module>
    StartServers             2
    MinSpareThreads          25
    MaxSpareThreads          75
    ThreadLimit              16
    ThreadsPerChild          16
    MaxRequestWorkers        48
    MaxConnectionsPerChild   0
</IfModule>
Here, ThreadsPerChild is set to 16. Since we didn’t define a ServerLimit, Apache used the default of 16. Multiplying these gives us a total of 256, which explains why our connection count averaged slightly lower at 229. The ThreadLimit directive was also set to 16, which prevented Apache from creating new threads as demand increased. Restoring the original configuration file resulted in an immediate increase in connections:

In many cases, both Apache and NGINX can see huge performance gains just by adjusting their configurations. They also benefit from the use of load balancers and multiple web servers running on different hosts. Had we implemented load balancing, we could have redirected traffic to another, less overloaded web server while our original server completed each request.
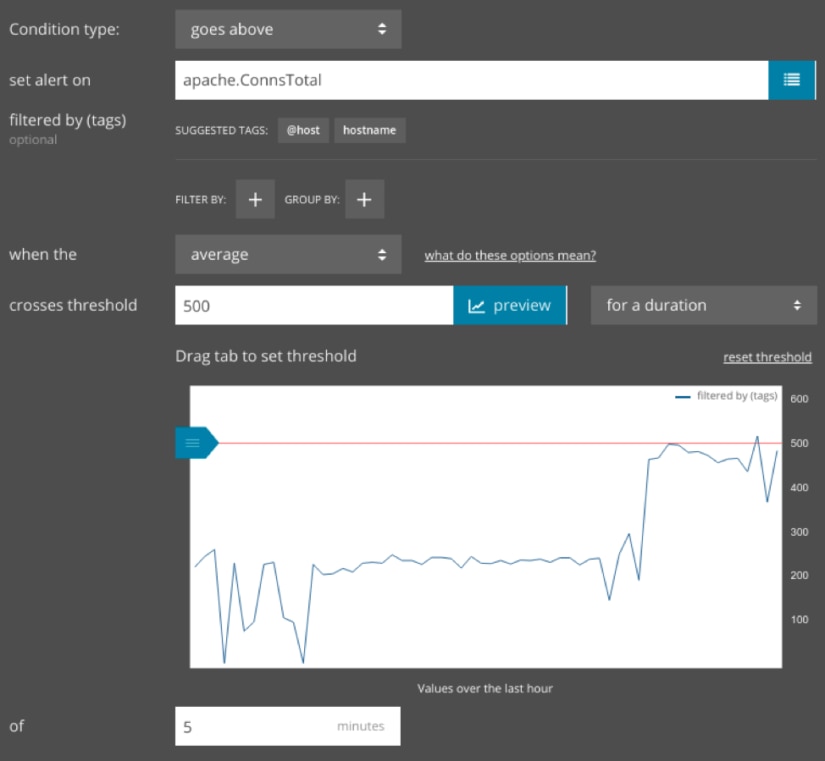
Monitoring for Future Occurrences
Although we increased our active connection limit, there’s still the possibility of our site slowing down due to heavy traffic. Collecting performance metrics will help us develop a new threshold based on our current Apache configuration. We can then create an alert that notifies us if the number of active connections exceeds this threshold for an extended period of time. This way, our engineers know when the server is nearing capacity.
Some web servers, such as NGINX Plus, provide an API for updating server configurations. For instance, if you used NGINX as a load balancing service, you can potentially create an alert that updates your load balancing rules programmatically, causing it to route traffic to another server until the current server becomes less saturated.
Conclusion
Web servers made the internet into the dynamic, interactive, and accessible platform we enjoy today. With SolarWinds AppOptics monitoring your web servers, you can make the web faster as well. Sign up for a free AppOptics trial and learn how to start monitoring your Apache and NGINX servers today.
As we saw, SolarWinds® AppOptics™ makes it easy to monitor web servers (alongside the application layer). You can take one of your databases for a test drive by signing up for a free 30-day trial.