
In our container monitoring guide, we explained how monitoring Docker will keep your containerized applications running smoothly. While container monitoring is important, most enterprises aren’t managing individual containers on a single host. Instead, they’re deploying hundreds, if not thousands of containers across multiple nodes, clusters, and regions. It is nearly impossible to manage these massive workloads on a per-container basis; however, orchestration tools such as Kubernetes can help.
Using Kubernetes, DevOps teams can deploy applications in an automated and resilient way. Engineers specify the end state of an application deployment, and Kubernetes handles the process of reaching that state. This makes it much easier and faster to deploy applications across a cluster of nodes while also enabling scalability, redundancy, and load balancing.
Why is Kubernetes Monitoring Important?
Kubernetes is used by 48% of the world’s largest organizations. It handles some of the world’s largest computing workloads including The New York Times, Squarespace, SoundCloud, and Pokémon Go.
As an orchestration tool, Kubernetes already tracks the health and stability of each of its components including containers, services, nodes, and load balancers. If any of these components has a problem, Kubernetes is designed to respond to it to minimize downtime and increase operational efficiencies. By monitoring Kubernetes, DevOps team members can monitor the state of the cluster and help Kubernetes perform more effectively.
Basics of Monitoring Kubernetes
Kubernetes handles a number of tasks including clustering nodes, deploying workloads (in the form of pods), tracking resources, and managing container runtimes. Monitoring Kubernetes involves collecting metrics, logs, and other telemetry data from each of these components and accessing them from a central location.
Collecting Kubernetes Metrics
Kubernetes metrics can be collected using a number of channels including the official Kubernetes command-line interface (kubectl), the Kubernetes dashboard, and third-party services.
The kubectl command reports real-time metrics on a per-node or cluster-wide basis. It uses Kubernetes’ Metrics API to collect metrics on resource usage, pod activity, and node health. The Metrics API is useful for hands-on troubleshooting, but since it only reports current metrics, it’s not as useful for viewing historical metrics.
SolarWinds® AppOptics™ is a SaaS service that can monitor Kubernetes along with your entire infrastructure and application stack. It provides a plugin that collects metrics from the Kubernetes API and each node in the cluster. It can also be used to query, analyze, and visualize Prometheus data. However, it provides many additional benefits like built-in distributed tracing. Also, the built-in dashboard includes metrics about pod status, deployment status, node status, and even the status of individual containers.
Collecting Kubernetes metrics via AppOptics is as easy as deploying a single pod. This pod communicates with the Kubernetes API to collect metrics on pods and containers, nodes, and deployments. The pod then sends these metrics to AppOptics where they are aggregated, monitored, and graphed. Alternatively, if you already have the AppOptics host agent installed on a Kubernetes master node, you can monitor your cluster by enabling the host agent Kubernetes plugin.
Analyzing Kubernetes Metrics
Kubernetes works on several layers, and as a result there are multiple types of metrics. AppOptics captures a large list of Kubernetes metrics, but we’ll focus on three:
- Pod metrics, which cover the state of individual pods
- Deployment metrics, which explain how pods are deployed and managed during runtime
- Node metrics, which cover individual hosts in the cluster
Pod Metrics
Pod metrics describe the state of individual pods.
When deploying a pod to a Kubernetes cluster, the Kubernetes scheduler selects
a node for it to run on. Kubernetes will report metrics on pods as soon as
they’re defined, which means you can track the state of a pod before it’s
deployed to a node. Pods that are scheduled but not running are recorded in the
kubernetes.pod.status.condition.scheduled
metric, while running pods are recorded in the kubernetes.pod.status.condition.ready. A pod is only considered successfully deployed once all of its
containers have been created and at least one container is running or starting.
To differentiate between multiple instances of the same pod, Kubernetes assigns each pod a unique identifier (ID). You can use this in AppOptics to filter metrics to individual pods for troubleshooting/pods also fall under a namespace, which is a virtual Kubernetes cluster with its own pods, services, and other resources. Kubernetes uses namespaces to separate internal services (such as the dashboard) from your workloads. Much like IDs, you can use namespaces to aggregate and filter metrics.
Pod Status
Pods can fall in one of several different states depending on where it is in the
scheduling process, as well as the status of their containers. In AppOptics,
these are tracked by the kubernetes.pod.status.phase.[State] metrics. Pod states include:
- Pending – the pod is waiting to be scheduled
- Running – the pod is scheduled, and its containers are running
- Succeeded – the pod completed its task and its containers were terminated
- Failed – the pod is stopped, and at least one of its containers stopped with a failure
- Unknown – the pod’s state can’t be determined
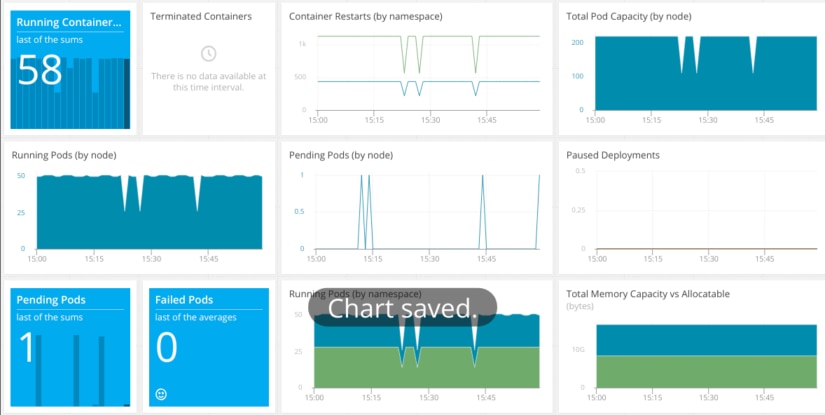
Tracking the state of your pods can alert you to deployment failures resulting from a scheduling error, unavailable resources, or an error in your application. For example, in the AppOptics dashboard shown above, the “pending pods (by node)” chart shows the number of pods waiting to be scheduled according to thekubernetes.pod.status.phase.Pending metric. A short increase is typical when creating a new deployment as pods are created and scheduled. However, a sustained increase could mean a scheduling failure due to low cluster resources or a problem with the scheduler itself.
Deployment Metrics
Deployments define the desired state of applications and their resources. They determine how pods are created, distributed, and replicated. Deployment metrics measure the state and availability of pods.
Like with pods, Kubernetes assigns each deployment a unique identifier. You can use this identifier to filter deployment metrics to a specific instance instead of viewing metrics across all deployments.
Replicas
Deployments don’t create pods themselves, but delegate the task to ReplicaSets. ReplicaSets ensure the number of running pods matches the deployment specification. ReplicaSets report aggregate pod metrics, including:
- Targeted – the total number of non-terminated pods managed by this ReplicaSet
- Unavailable – the number of pods in an unavailable state
- Available – the total number of pods currently deployed
- Desired – the number of desired pods according to the deployment
- Updated – the number of non-terminated pods matching the latest deployment specification
These metrics can help you monitor and determine deployment-specific errors and problems. For example, if the number of available pods is less than the number of desired pods, you can assume the deployment is either in the process of creating new pods or failed to meet specifications. AppOptics records these metrics as kubernetes.deployment.status.[State]Replicas, e.g. kubernetes.deployment.status.TargetedReplicas and kubernetes.deployment.status.UnavailableReplicas.
Failed Deployments
A Deployment is considered unfinished if its
current state does not equal the desired state. This could indicate an ongoing deployment
or a failed deployment. If a deployment remains in the unfinished state for too
long, there could be underlying problems with its configuration or the
Kubernetes cluster. AppOptics records unfinished deployments in the kubernetes.deployment.status.deploynotfinished metric.
Node Metrics
Lastly, node metrics describe the state of each node. Kubernetes tracks node metrics to determine where to deploy new pods, and in the event of a failure, how to redistribute terminated pods.
A node can only host a pod if it has enough
computing resources available. Pods need CPU, RAM, network capacity, and disk
space to run. The pod scheduler must be aware of each node’s resources to
efficiently distribute pods throughout the cluster, avoid bottlenecks, and
balance load. AppOptics provides these metrics under the kubernetes.node.status.allocatable and kubernetes.node.status.capacity namespaces;
for example, the total amount of RAM on a node is measured by kubernetes.node.status.capacity.memory.bytes.
Host Metrics, Logs, Distributing Tracing and More
Many factors can affect the performance and stability of a Kubernetes deployment. The AppOptics Kubernetes plugin automatically collects pod, host, and deployment metrics, but troubleshooting problems requires more granularity.
You can use the SolarWinds DaemonSet to collect both node metrics, as well as container-specific metrics including resource consumption, I/O access, and container status. See our articles on a definitive guide to host monitoring and container monitoring to learn more.
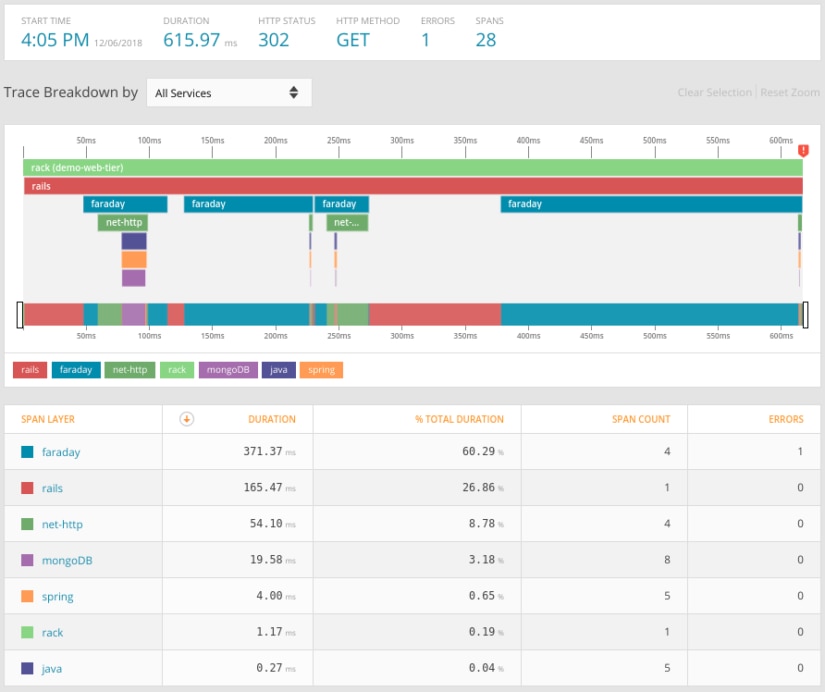
For more detail, AppOptics APM lets you trace distributed transactions. For example, the following screenshot shows a trace of an HTTP request to a three-tier web application. Even though the application is split across multiple pods, we can see each step including calls to backend and database services:
Logging your Kubernetes applications is also important for monitoring application activity and quickly detecting problems. Kubernetes appends valuable data to each event generated by your applications including the pod ID, Kubernetes deployment, namespace, and host. Integrating Loggly with Appoptics lets you track user-specific requests across your nodes and services, correlate metrics to events, and get full observability into your cluster.
Troubleshooting a Kubernetes Deployment
Although Kubernetes abstracts away the details of container management, that doesn’t mean it can run on its own. Orchestration tools still require monitoring in the case of a deployment or application failure. Let’s look at a situation where a newly built deployment doesn’t perform as expected.
In this example, we want to deploy a website. We have a simple deployment running a Nginx pod with multiple replicas for load balancing. However, we’ve noticed our website appears to be running slower than expected, and after reviewing host metrics, all of our network traffic appears to be going to a single node. To troubleshoot this issue, we need to find out what exactly is happening and why our deployment isn’t scaling properly.
Step 1: Checking Resources
Although our deployment is relatively small, resource exhaustion is still a possibility. We need to make sure our cluster has enough CPU, RAM, disk space, and network bandwidth to host our pods, otherwise Kubernetes may refuse to schedule them. For our Kubernetes cluster, we use SolarWinds AppOptics to collect metrics from each of our nodes. We can then use the host agent dashboard in AppOptics to graph out resource usage across our cluster:
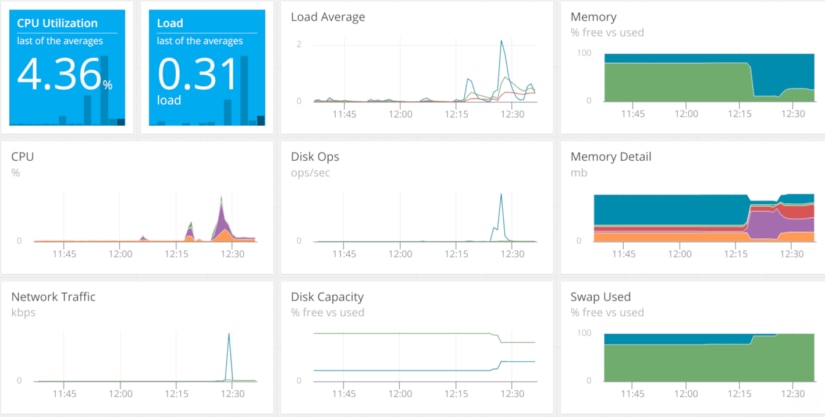
According to AppOptics, we have plenty of available capacity. We can verify this by using the kubectl top command:
$ kubectl top node
Name | CPU (cores) | CPU% | MEMORY (bytes) | MEMORY% |
k8s-host | 117m | 5% | 1449Mi | 57% |
Having ruled out resource exhaustion, let’s dig a little deeper into Kubernetes metrics.
Step 2: Identify the Cause
Next, let’s make sure there aren’t any
problems with our Kubernetes deployment. We can view the our deployment status
using AppOptics by navigating to dashboards and opening the Kubernetes
dashboard. This dashboard includes several charts that display the number of pods
by their state. Here, we can see that one of our pods is in the pending state
as measured by the kubernetes.pod.status.phase.Pending metric:
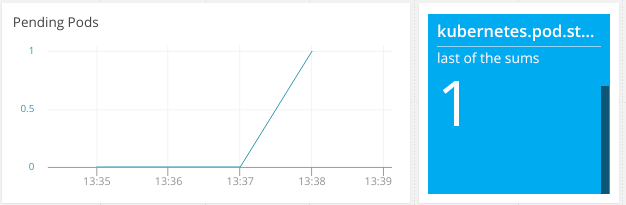
The question is: Our other pods deployed immediately, so why is this one taking so much longer?
Step 3: Gather Information
We can use the Kubernetes command line interface to find out which pod failed to deploy and why. We can retrieve a list of pods and their statuses using kubectl get pods:
user@k8s-host:~$ kubectl get pods
NAME                               READY   STATUS    RESTARTS   AGE
nginx-deployment-b7bb58d5d-2gsx7   1/1     Running   0          19m
nginx-deployment-b7bb58d5d-kdp9v   0/1     Pending   0          19m
This confirms one pod is stuck in the Pending state. While we can’t retrieve logs or metrics from the pod itself (since it never actually ran), we can view events related to the pod using kubectl describe pod:

Here we can see the exact problem. The pod can’t deploy since it’s attempting to use a port on the host. Mapping a pod port directly to a host port is an anti-pattern and indicates a key problem with our application. Let’s look at the deployment configuration to see the problem.
Step 4: Resolve the Problem
Our Deployment currently looks like this:
apiVersion: apps/v1
kind: Deployment
metadata:
  name: nginx-deployment
spec:a
  selector:
    matchLabels:
      app: nginx
  replicas: 2
  template:
    metadata:
      labels:
        app: nginx
    spec:
      containers:
      - name: nginx
        image: nginx:latest
        ports:
        - containerPort: 80
          hostPort: 80
The most important item here is hostPort. With hostPort, Kubernetes maps a port on the pod directly to a port on the host. This is not best practice for multiple reasons:
- Only a single vod using the port can run on a host at a time.
- Any other processes requiring access to the port will fail to run.
- Outside users can access the pod through the host and not through Kubernetes. This completely bypasses Services, Ingress controllers, load balancers, security policies, and other useful networking features.
To fix this, we need to replace hostPort with a Service and Ingress. Ingresses provide communication between pods and the outside world, while Services apply the Ingress to our pods. Not only does this prevent backdoor access to our applications, but it automatically works for all pods in our Deployment no matter how big we scale it.
apiVersion: v1
kind: Service
metadata:
  name: nginx-service
spec:
  selector:
    app: nginx
  ports:
  - protocol: TCP
    port: 80
    targetPort: 80
---
apiVersion: extensions/v1beta1
kind: Ingress
metadata:
  name: nginx-ingress
spec:
  rules:
  - http:
      paths:
      - path: /
        backend:
          serviceName: nginx
          servicePort: 80
---
apiVersion: apps/v1
kind: Deployment
metadata:
  name: nginx-deployment
spec:
  selector:
    matchLabels:
      app: nginx
  replicas: 2
  template:
    metadata:
      labels:
        app: nginx
    spec:
      containers:
      - name: nginx
        image: nginx:latest
        ports:
        - containerPort: 80
Step 5: Monitor for Future Occurrences
With Kubernetes reporting metrics on both pod and Deployment states, we can easily monitor for incomplete or suboptimal application deployments. For example, we can create an AppOptics alert that notifies the DevOps team if the kubernetes.deployment.spec.deploynotfinished metric goes above zero for an extended amount of time (e.g. five minutes). If a Deployment takes this long to finish, there’s likely another problem preventing it from completing successfully.
We can also monitor Kubernetes for immediate problems. For example, we might want to alert the team if the kubernetes.node.spec.unschedulable metric goes above zero for any length of time. This means one of our nodes can no longer run new pods, whether it’s out of resources or for another reason. Another metric to consider for instant alerting is kubernetes.pod.status.phase.Failed, which tracks the number of pods that have failed to run.
Conclusion
The microservice architecture is spreading, and Kubernetes is leading the charge. More and more enterprises are using Kubernetes to manage their applications. Knowing how to monitor Kubernetes deployments will help you keep your services running and your customers happy.
To learn how SolarWinds AppOptics can help you monitor your Kubernetes cluster, click here. You can get started with a free trial account and begin viewing your Kubernetes metrics in a matter of minutes.