Why did we build this?
Because you told us to!
When SolarWinds® AppOptics™ launched in November 2017, it merged application performance monitoring, infrastructure monitoring, and custom metrics into a solution that enables a deeper understanding of system performance in one tool. As more and more customers began using AppOptics, we gathered feedback on the product and kept hearing the same thing: “We want exception tracking!”
We listened to your feedback and now we’re happy to announce that we have added exception tracking to AppOptics, combining it with application performance, infrastructure monitoring, and custom metrics in one seamless user experience.
How does it work?
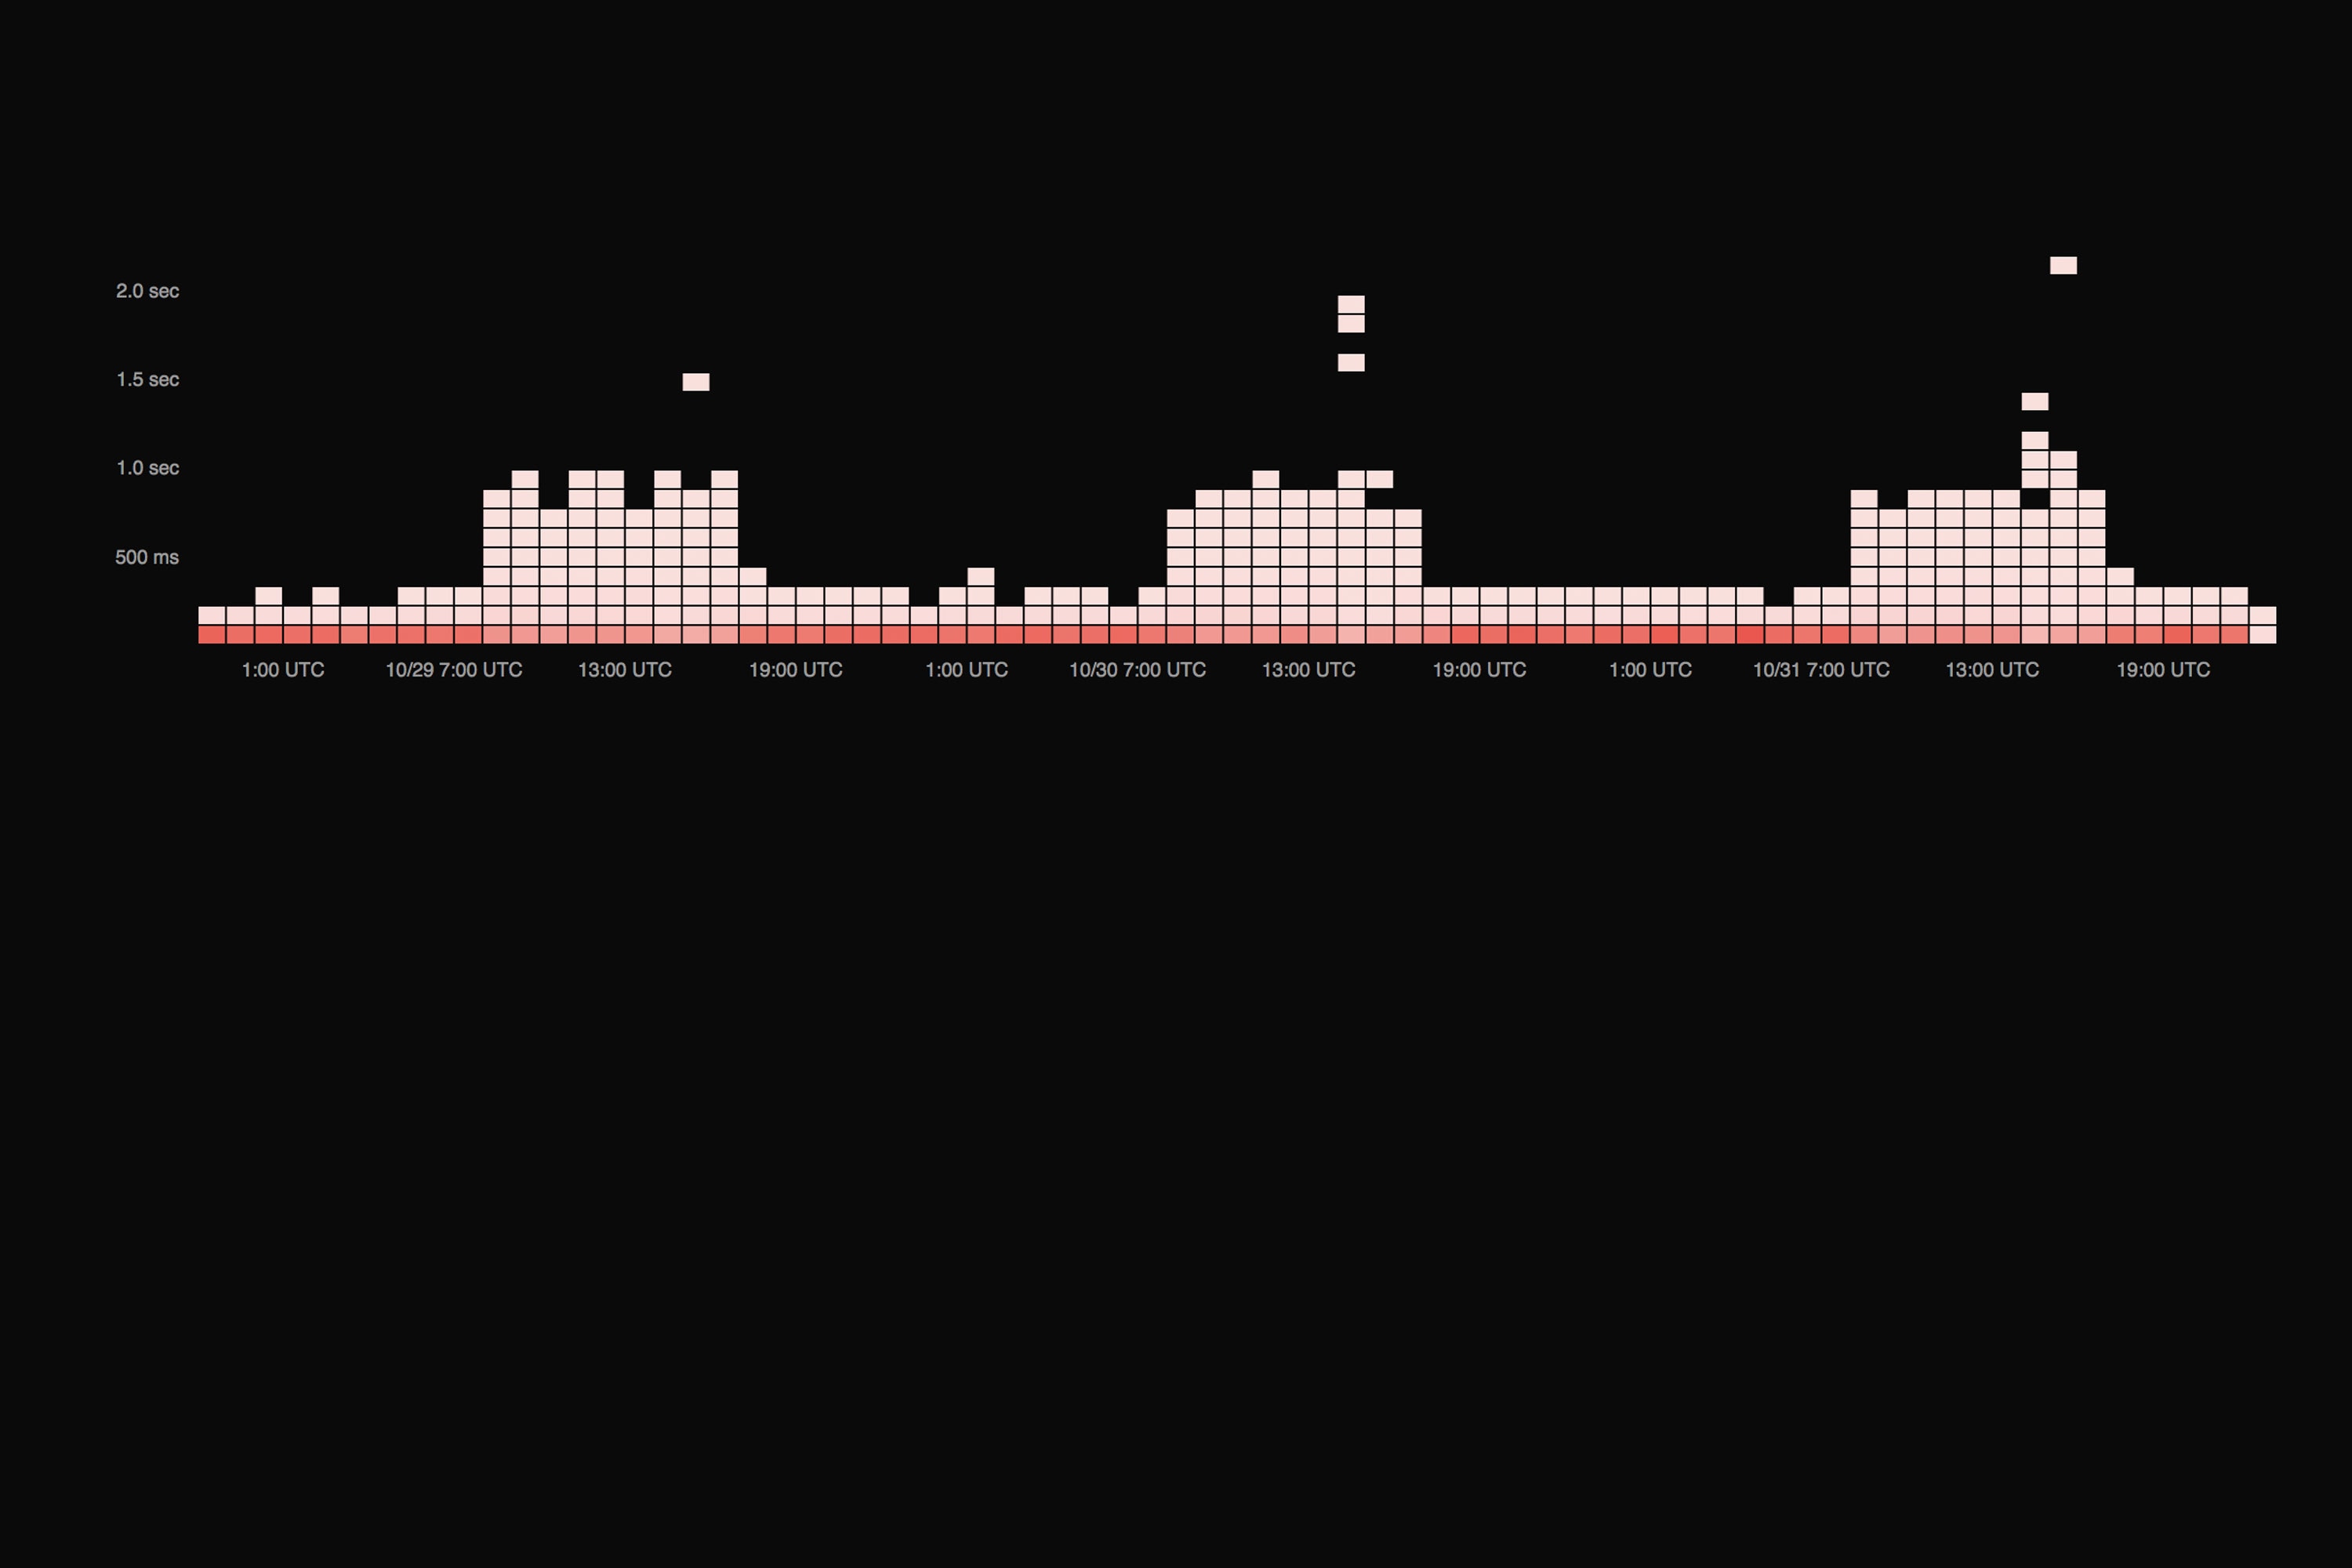
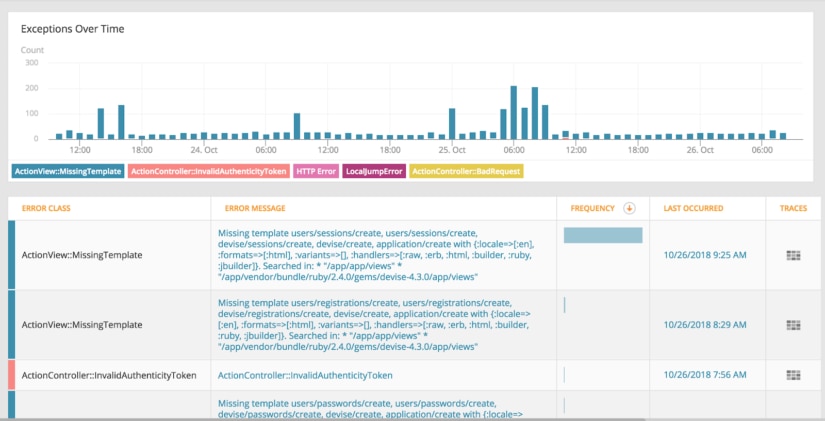
The new exceptions tracking feature builds on top of the AppOptics automatic tracing capability, providing a summary of exceptions happening within a service context. When troubleshooting a service, simply click on the exceptions tab at the top of the page to understand the current volume of exceptions, when they started, and which exceptions are most frequent. You can even drill into each exception, viewing the stack trace, and which endpoints in the application are throwing them.

Exceptions in distributed services
If it’s 3 a.m. and you just got paged, you likely want to know the scope of an issue to understand if it needs to be resolved immediately. AppOptics exception tracking enables you to drill down from a summary of exceptions to view a specific exception in the context of a distributed trace. Simply click on “last occurred” to bring up a specific example of where in the system this exception was thrown and if it propagated to upstream tiers.

Are application exceptions related to infrastructure?
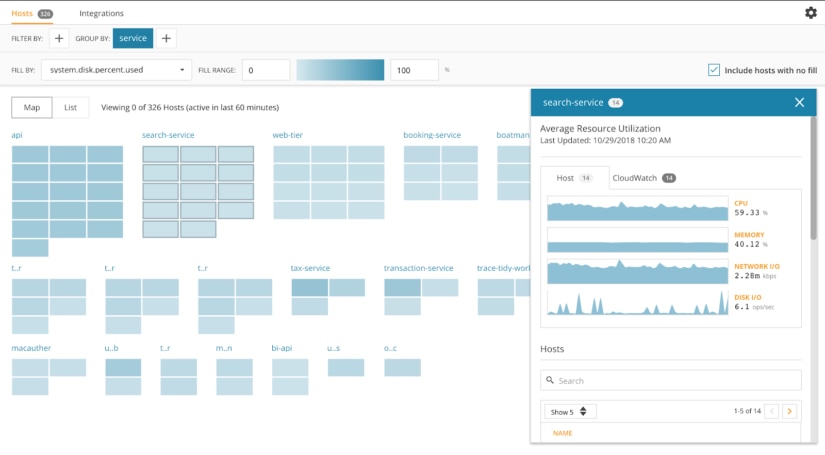
If a service is throwing exceptions such as thread exhaustion or disk I/O messages, the next logical step is to look at the health of the underlying infrastructure. AppOptics enables you to quickly jump from a service context, to the infrastructure running that service. The next time you see a scary thread pool exhausted error, you can quickly understand how you arrived at that state and have the information available to right size the infrastructure behind it.
All AppOptics accounts now have access to exception tracking. If you aren’t yet using AppOptics to monitor system performance, you can sign up for a free trial account here.