New Integration Between AppOptics, Loggly, and Papertrail
Today we are pleased to announce we have brought SolarWinds® AppOptics™ application performance monitoring (APM) even closer together with our SaaS-based log management products—SolarWinds Loggly® and SolarWinds Papertrail™. It just takes one click of a button to automatically drill down from an AppOptics trace into the group of log events associated with that trace in Loggly or Papertrail. Now you can quickly move from service-level metrics, down to a trace, and then down to the logs specific to that trace, further reducing the time to troubleshoot application performance problems.
The integrations leverage the new, recently announced shared SolarWinds Snap Agent. AppOptics libraries use auto-instrumentation and context propagation through HTTP headers. This means if your application is in Go, Java, Node.js, PHP, or Ruby, there is no instrumentation needed. You can leverage context tracking of logs out-of-the-box from a trace view in AppOptics, which allows you to explore latency and span counts.
Why is this important? It can be hard to track the root cause of a problem from distributed systems’ logs due to the lack of connection between logs. One way people solve this today is by using distributed tracing. Distributed tracing on its own is impressive, but adding a simple, single click, to drill down directly from that trace into the associated logs for that request is game-changing. By using distributed tracing to generate and propagate context (i.e., trace IDs) throughout the lifetime of requests and then annotating this context on associated log lines, we create logs with distributed context. These context-rich logs in Loggly and Papertrail allow users to isolate individual requests across all systems for better diagnostics.
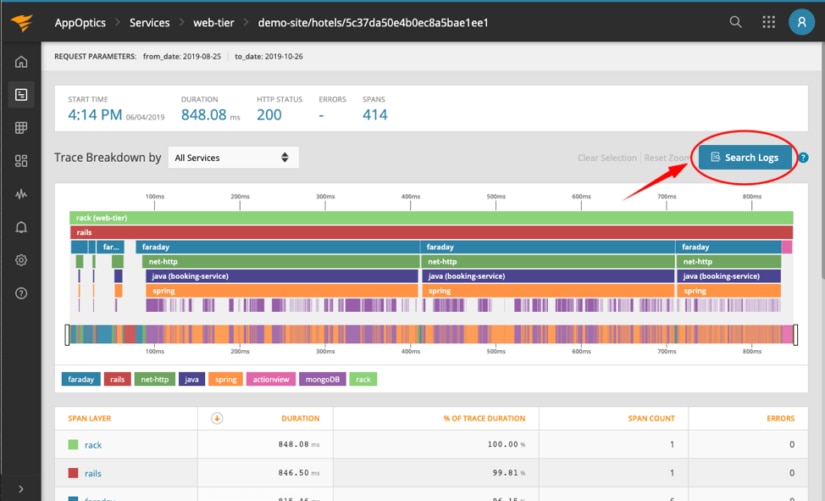
Below are two examples of grouped log events as a result of clicking on the “Search Logs” button on an AppOptics trace.
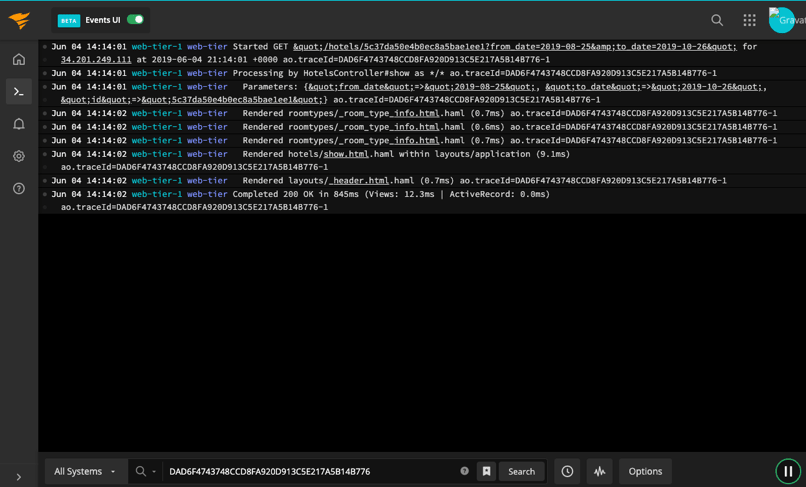
This first example is showing the grouped logs in Loggly associated with the above trace.

This second example is from the same AppOptics trace into Papertrail.
Usually, when you are troubleshooting an issue like this, the exception or error provided by the trace may be all you have to work with, and you are forced to guess which log messages relate to it. With the AppOptics log integration, you now have all the logs associated with that one request.
To learn more about the new trace context in logs integration and the SolarWinds APM products, visit the SolarWinds AppOptics, SolarWinds Loggly, and SolarWinds Papertrail websites. Take AppOptics out for a spin—try it for free for 14 days.