Introduction
The AppOptics APM and infrastructure monitoring SaaS runs on Amazon Web Services (AWS). Our AppOptics metrics API is a key part of that infrastructure, consuming large volumes of time-series metrics. AppOptics provides a POST API that consumes time-series metrics from any number of collection agents written by AppOptics or by third-parties. Customers can write their own instrumentation libraries or monitoring scripts that push data to the API. Our API routinely processes over 15,000 requests per second over millions of data streams.
This post is the first of a two-part series on how we have scaled this API tier on AWS using AWS Elastic Load Balancing to serve our API traffic. This first post will examine how we migrated from the Classic Load Balancer to the Application Load Balancer and worked around differences in the request routing algorithms to minimize downtime during deploys.
Background
Our main UI and API endpoints are served by Nginx instances that perform various path and HTTP verb-based routing decisions to route traffic to various front-end and back-end service tiers. For simplicity, it’s enough to say that the main API endpoint that consumes all metrics traffic is the majority of our API traffic. The POST routes for incoming metrics measurement data is proxied to an internal Elastic Load Balancer that fronts a service called Jackdaw [1].
Jackdaw is a Java 8 DropWizard application that consumes, validates, rate-limits, and eventually persists all incoming measurement data in the AppOptics platform. It is the initial workhorse in our time-series data platform — all measurement data enters into the data pipeline via Jackdaw. Each Jackdaw instance is responsible for serving over 1,000 requests per second and processing 30,000+ measurements per second via batched payloads. Each instance is scaled to handle up to two times this load in case of complete AZ failure or unexpected traffic spikes.
Last year, we decided to upgrade the load balancer in front of Jackdaw from the AWS Classic Load Balancer (ELB) to the newer Application Load Balancers (ALB). This effort was largely driven by the sudden introduction of a new workload pattern that would cause the Classic Load Balancer software to regularly crash in front of this service tier. This would cause brief large spikes in 503 errors as the load balancer crashed on an instance and was restarted. We hoped the newer ALBs would not be susceptible to the same issue and we decided to upgrade to see if that resolved the crashes.
Deployment trouble
Our deployment process for Jackdaw, and many other data services, uses a rolling model that deploys to one instance at a time. This is a fast and efficient process, and the automation required is fairly minimal. Our deployment scripts take one instance out of the load balancer at a time, ship the latest application version, and re-register it with the load balancer once the app is healthy. When using the Classic Load Balancers, this process showed no impact to customer’s requests as instances were swapped in and out.
When we moved the Jackdaw service to the Application Load Balancers, we quickly discovered that our deployment process was no longer transparent to customers. We used the same exact process for in-place, rolling deployments when we switched to the ALBs, but each time a new instance was brought online, we noticed a large spike in response latency and dropped requests. Our normal 95th percentile latency for the Jackdaw service is less than 200ms across all requests. As the following graph shows, following a deployment to a single canary instance, we saw latency spikes over 15 seconds for p95, p99, p99.9, and max latency.
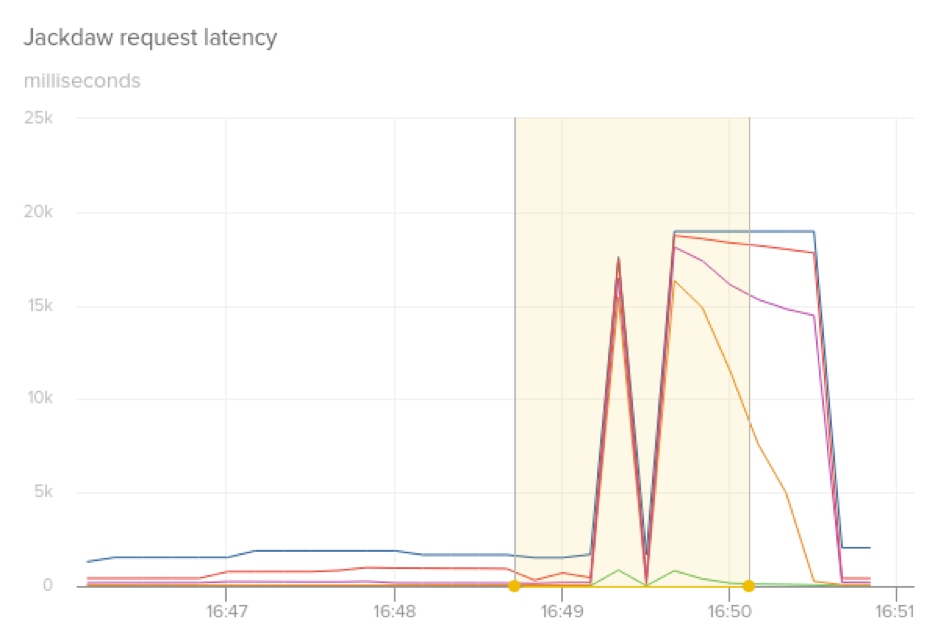
After a lot of debugging, we identified that after an instance was added back to the ALB, it would get a sudden huge spike of new connections and requests. The connection count would spike 10 times over normal operating range, and CPU from the sudden connection spike was negatively affecting request latency. We tried several different approaches of pre-warming caches, initializing larger initial thread pool sizes, and running synthetic requests through the service before it was put into service. However, while we made small improvements on latency, we were still causing significant disruption to customer traffic, since it was difficult to completely replicate cache and thread pool state prior to restart.
Load balancing overview
A complete understanding of the problem we were experiencing requires a quick background on how AWS load balancers work. When you provision a load balancer, AWS creates one or more instances per Availability Zone to accept traffic and route that traffic to your back-end instances, which looks approximately like this.
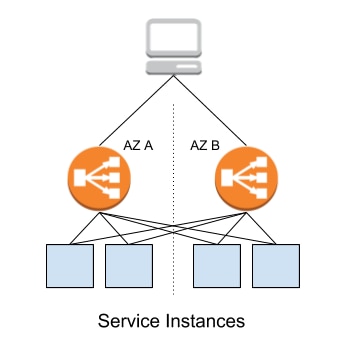
AWS load balancers use different algorithms to route traffic from the front LB instances to your back-end instances. With Classic Load Balancers, the least-outstanding-requests algorithm is used, which is simply the instance with the fewest pending requests. The newer Application Load Balancers use round robin routing within a given target group, leading to a fairly even distribution of requests.
In our particular use case, we have a high request volume and low percentile latency per request. When an instance is added back into service, its latency is going to be slightly higher as it begins to warm internal caches, JIT compilation catches up, and thread pools grow to their optimal sizes. With the Classic Load Balancer, the increased latency of these first requests, while still below acceptable service SLAs, would increase pending request queues for the given instance. The least-outstanding-requests algorithm would cause request volume to back off this instance and ensure a slower traffic ramp up. However, with the ALB, the request volume for an instance joining the ALB would immediately consume 1/N of the total traffic. This led to a spike in ALB->instance connections as the ALB required more connections to distribute the same number of requests with higher latency. The large connection spike inversely affected the service even further, leading to the latency spikes over ten seconds for a minute or two after deployment.
Solution
The team considered many different options on how to address the inability to ship this service tier without affecting customer experience. We floated the option of adding another proxy tier (NGINX or HAproxy) in front of our service instances to detect back pressure when a new service instance was added and spread the requests across all instances in the tier. We also considered just removing this internal load balancing tier completely and having our public API endpoints route directly to the back-end service instances using service discovery. However, both of these options added complexity to a deployment process that had been working smoothly for years over thousands of deployments.
We landed on a solution that relied on understanding how the ALB instances route requests to the back-end instances. Each load balancer instance, which there are one or more of per Availability Zone, independently executes the health check setup as part of the target group configuration. Each ALB instance then independently decides whether a back-end instance is healthy and whether to route requests to it.
Leveraging this knowledge, we created a custom health check endpoint in our back-end service that gradually transitioned the status of the service instance from unhealthy to healthy across the set of fronting load balancer instances. The health check would inspect the peer address of the incoming health check request and return a response of healthy or unhealthy based on the progress of the traffic ramp-up. This allowed us to slowly increase traffic to the newly registered instance, giving the internal caches enough time to properly warm up. By hashing the peer address, we could perform this ramp-up using a stateless model.
The resulting health check resembles the following code snippet. We chose a ramp-up period of 60 seconds until the instance would report 100% success. We refer to the health check as “flapping” until it reaches 60 seconds since the first invocation of the health check.
Instant begin = null;
Duration flapDuration = Duration.ofSeconds(60);

public Response check(HttpServletRequest request) {
    String peer = request.getRemoteAddr();
    Instant now = Instant.now();

    if (begin == null) {
        // Start on first healthcheck call
        begin = Instant.now();
    }
    Instant flappinessEnd = begin.plus(flapDuration);
    if (now.isBefore(flappinessEnd)) {
        float secondsSinceBegin = Duration.between(begin, now).getSeconds();
        float percentEnabled = (secondsSinceBegin / flapDuration.getSeconds()) * 100;
        Hasher h = Hashing.murmur3_32().newHasher();
        h.putString(peer, Charset.defaultCharset());
        long peerHash = Math.abs(h.hash().asInt());
        if (peerHash % 100 > percentEnabled) {
            return Response.serverError().build();
        }
    }
    return Response.ok().build();
}
Results
With this in place, we tried a deployment to a single canary instance.
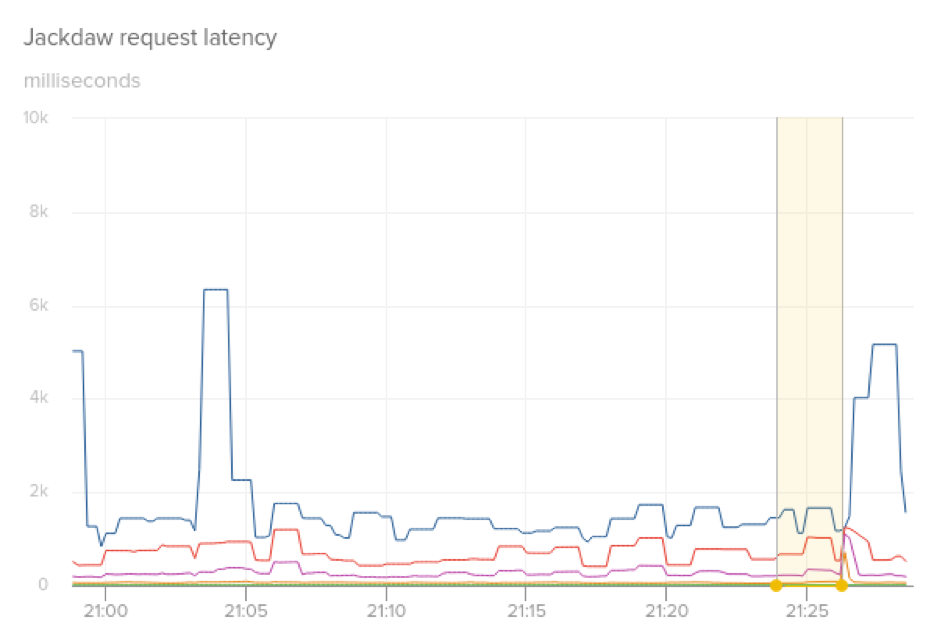
The p95 and p99 latency remained consistent, and we only saw a slight bump on the maximum latency. This was much better than what we saw previously, and we didn’t notice timeouts from our collection agents that post to the API. We continued with a three instance deployment to ensure the results were consistent.
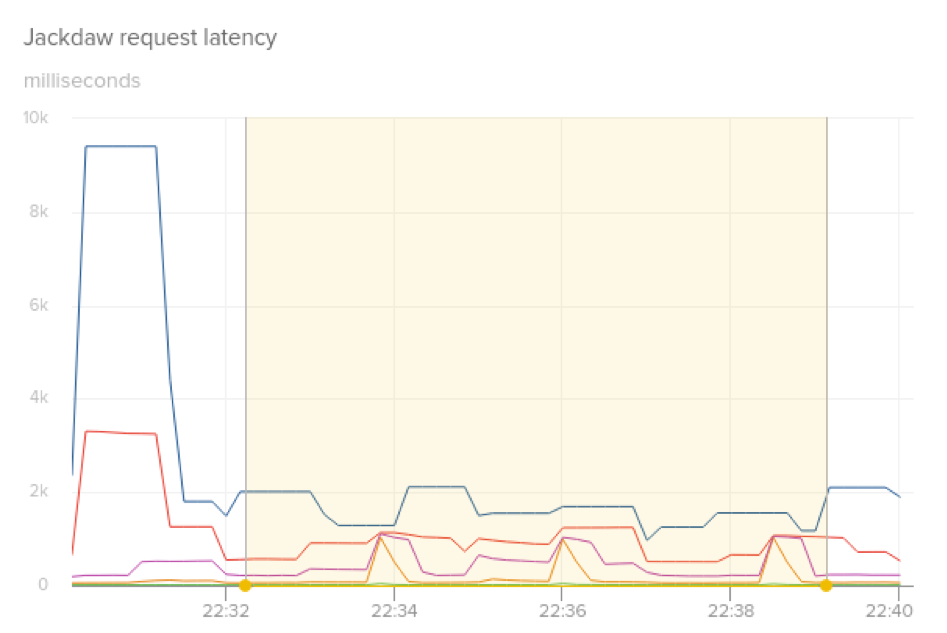
The following logs demonstrate the process right after an instance is deployed and is ramping up, marking peers as denied (unhealthy) or allowed (healthy).
May 01 20:23:18 c.l.j.h.HealthcheckResource: Peer 172.26.51.36, hash 234237154, % enabled 0.0
May 01 20:23:18 c.l.j.h.HealthcheckResource: Peer 172.26.51.107, hash 652717793, % enabled 0.0
May 01 20:23:18 c.l.j.h.HealthcheckResource: Peer denied: 172.26.51.36
May 01 20:23:18 c.l.j.h.HealthcheckResource: Peer denied: 172.26.51.107

May 01 20:23:28 c.l.j.h.HealthcheckResource: Peer 172.26.51.136, hash 22700163, % enabled 15.000001
May 01 20:23:28 c.l.j.h.HealthcheckResource: Peer denied: 172.26.51.136

May 01 20:23:33 c.l.j.h.HealthcheckResource: Peer 172.26.51.254, hash 394429823, % enabled 23.333334
May 01 20:23:33 c.l.j.h.HealthcheckResource: Peer allowed: 172.26.51.254

May 01 20:24:18 c.l.j.h.HealthcheckResource: Peer 172.26.51.107, hash 652717793, % enabled 98.333336
May 01 20:24:18 c.l.j.h.HealthcheckResource: Peer allowed: 172.26.51.107
Measuring the request rates at an interval of 10 seconds showed that it would take about 40-50 seconds for a single instance to return to its original traffic volume.
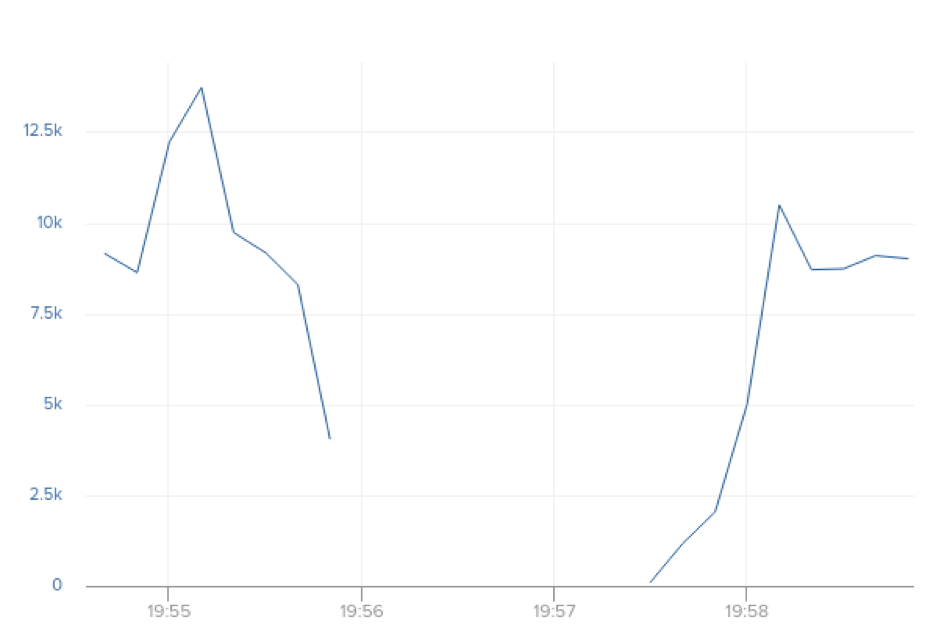
With this in place, we can now safely deploy to this service tier again without concern for customer impact. Confirming that we can deploy regularly without customer impact is critical for maintaining developer velocity. We practice continuous delivery, so we often need to ship the same tier multiple times in a single day.
Wrap up
In the second part of this series, we will examine how we tracked down very infrequent 502 and 503 errors that we would periodically see from requests hitting the Jackdaw ALB.
Debugging a problem in a high-scale system in production requires great monitoring tools. We used a combination of AWS Cloudwatch monitoring and sub-minute custom metrics monitoring with AppOptics to track this down. AppOptics is a complete APM and infrastructure monitoring tool built from the combination of TraceView and Librato products. Sign up for a 14-day free trial today.
If this type of debugging at scale is interesting, we are hiring for several different roles across many teams. Come work with us!
[1]: For us “Jackdaw” does not refer to the bird, but instead the protagonist’s ship in Assassin’s Creed: Black Flag.
Discussion: Hacker News


