
Prometheus is an all-in-one, open-source monitoring solution. While metrics are commonly visualized using Grafana, a commercial application monitoring solution like AppOptics™ can offer extra functionality. In this article, we will take a look at setting up a simple web service, using Prometheus to gather metrics, and using AppOptics to display those metrics and fire an alert.
What is Prometheus?
Prometheus is designed for operational simplicity. While Prometheus has many modern features for metrics collection, one of the most important is that it is completely self-contained without any external data sources or distributed systems to manage. This helps make Prometheus easy to deploy and operate.
In most metrics collection systems such as Graphite, applications are responsible for sending or pushing their metrics to a centralized service. While this is convenient, it places the burden on applications to fail gracefully when the metrics service is unavailable. Typically, these collectors are low latency and maintain a persistent connection over TCP or UDP to minimize bandwidth usage. This requires the metrics service to scale to maintain connections across every process being monitored, making scaling your metrics as important as scaling your applications themselves.
Prometheus differs from these monitoring systems in that it is pull-based. Instead of metrics being sent by applications, Prometheus receives a list of HTTP endpoints from configuration or service discovery and queries them on periodic intervals. This is still bound to the same scaling concerns that any other application has, as the number of endpoints that must be scraped over an interval increases. To solve this, the Prometheus server is able to expose its own collected metrics as metrics themselves, allowing operators to “stack” Prometheus instances and expose only the resolution needed at each monitoring tier.
While this works for HTTP services, this does not solve the challenge in monitoring hosts, workers, and other traditionally push-based metrics. While Prometheus by itself is standalone, it comes with an ecosystem of services to extend its functionality for this and other use cases:
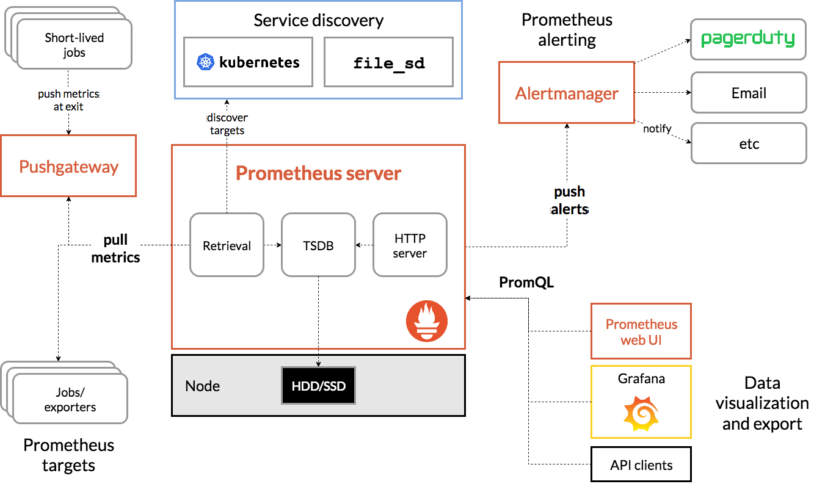
This diagram shows the relationship of the Prometheus server to other components. By using the Prometheus Pushgateway component, workers are able to push their results. Prometheus then scrapes Pushgateway to get the aggregate information for these jobs. Alerting is provided through the Alertmanager service. Other exporters are provided by the Prometheus team and third parties to monitor hosts, databases, or even existing statsd-based systems.
What makes Prometheus so powerful is that it fits into your existing infrastructure, rather than having to work around it.
When not to use Prometheus
While Prometheus provides a lot of upsides, it is not appropriate for every environment. First and foremost, Prometheus is a pull-based system, and in high security or air-gapped environments ensuring that Prometheus can scrape all of its targets (including other Prometheus systems) can be challenging to accomplish successfully. It will require you configure inbound access through firewalls and VPNs.
Additionally, while Prometheus is lightweight and self-contained, it still is a system that must be run by operators and requires maintenance over time. It must be monitored and have alerts as well, which can be done with separate Prometheus instances. This all requires effort and time.
Pull or scraping metrics also introduce some challenges over push-based models. While the scraping interval can be set as short as one second, this rolling window isn’t guaranteed when there are many services to scrape. While Prometheus is excellent at collecting data in aggregate and presenting it, it is not receiving every individual data point as push-based systems would. As a result, fairly high resolutions may not necessarily show every point of data.
For use cases such as per-second billing, Prometheus is not a good fit. Accounting for the possibility of failed scrapes introduces some complexity into stateful metrics such as counters or heartbeats. Prometheus has special functions to track counters and rates. You must also be clever about writing alert rules to avoid false positive alerts when there is a delay scraping metrics, resulting in stale data. For example, instead of alerting on count < one, alert on an average over the past five minutes to give some leeway for scraping to recover.
Why use AppOptics
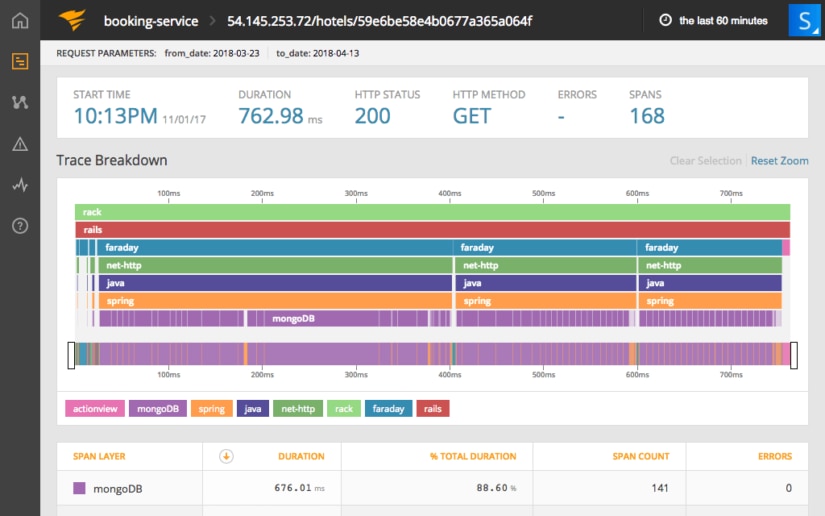
Prometheus data can be queried and analyzed using a number of front-ends, but Grafana is most commonly used. Prometheus monitoring using AppOptics is advantageous in that it gives you a more complete picture by combining infrastructure metrics with application performance monitoring (APM) and distributed tracing. This means you won’t have to switch back and forth between multiple windows when troubleshooting problems. Features like distributed tracing (shown below) make it easier to find the root cause of performance problems, especially in distributed microservices architectures.
It’s easy to export metrics from Prometheus to AppOptics. We’ll show you how in the example below.
Deploying a Prometheus-ready service
Prometheus ships with official clients for Go, Java, Scala, Python, and Ruby. Unofficial clients exist for other languages. Using the Ruby client, let’s add Prometheus functionality to a Ruby on Rails application.
After creating a basic Rails application with `rails new,` adding the Prometheus client is as simple as adding `prometheus-client` to your Gemfile:
gem 'prometheus-client', '~> 0.8.0'Ruby on Rails is based on Rack, a middleware system for Ruby. This allows users to inject functionality into Rack-based applications at a low level. The Prometheus client exposes two Rack middlewares, one for exposing a metrics endpoint and another for collecting statistics about each request.
In Rails, this is added to the `config/application.rb` file. After setting up the middleware, this file should look like:
require_relative 'boot'

require 'rails/all'
require 'prometheus/middleware/collector'
require 'prometheus/middleware/exporter'

Bundler.require(*Rails.groups)

module Prometheusapp
  class Application < Rails::Application
    config.load_defaults 5.2
    config.middleware.use Prometheus::Middleware::Collector
    config.middleware.use Prometheus::Middleware::Exporter
  end
end
For standard HTTP metrics, we’re done. This will automatically collect information about each of our requests. The Prometheus client also has methods for collecting arbitrary information, which is useful for collecting other important business and operational metrics. After starting the Rails application, we can navigate to `/metrics` and get the metrics output for Prometheus:
# TYPE http_server_requests_total counter
# HELP http_server_requests_total The total number of HTTP requests handled by the Rack application.
http_server_requests_total{code="200",method="get",path="/"} 5.0

# TYPE http_server_request_duration_seconds histogram
# HELP http_server_request_duration_seconds The HTTP response duration of the Rack application.
http_server_request_duration_seconds_bucket{method="get",path="/",le="0.005"} 0.0

...# TYPE http_server_exceptions_total counter
# HELP http_server_exceptions_total The total number of exceptions raised by the Rack application.
http_server_exceptions_total{exception="RuntimeError"} 1.0
This is broken up into three sections:
- In the “http_server_requests_total” section, we are presented with the total HTTP requests that the server has received, grouped by status code, method, and endpoint.
- In the “http_server_request_duration_seconds” section, our server is presenting a histogram of our application’s request duration. This helps with identifying outliers in performance.
- The last section, “http_server_exceptions_total,” contains metrics about the number of exceptions that have occurred during the lifetime of the application.
Out of the box, we are provided with enough information to get a general understanding of our application’s health. Now that we have them, let’s scrape them via Prometheus.
Using Prometheus for the service
Now that our application is running, we need to configure Prometheus to scrape it. Prometheus is configured via a YAML file that defines a list of scraping targets and other options. While service discovery is supported for a variety of tools, we will use the static target for this application. This allows us to specify a URL instead of worrying about setting up some service discovery layer.
For this application, our `prometheus.yml` file looks like:
global:
  scrape_interval: 10s
scrape_configs:
  - job_name: rails
    static_configs:
      - targets:
        - localhost:3000
Using this configuration, we will scrape our local Rails server every 10 seconds. This can be overridden in each target, but here we specify it at the global level. Now, run Prometheus with:
prometheus --config.file=prometheus.ymlPrometheus ships with a basic dashboard for running queries and generating graphs. This is a useful tool for testing queries before exposing them to other tools such as Grafana or AppOptics.

Prometheus comes with a robust query system. Querying our http_server_requests_total gives us an interesting graph:
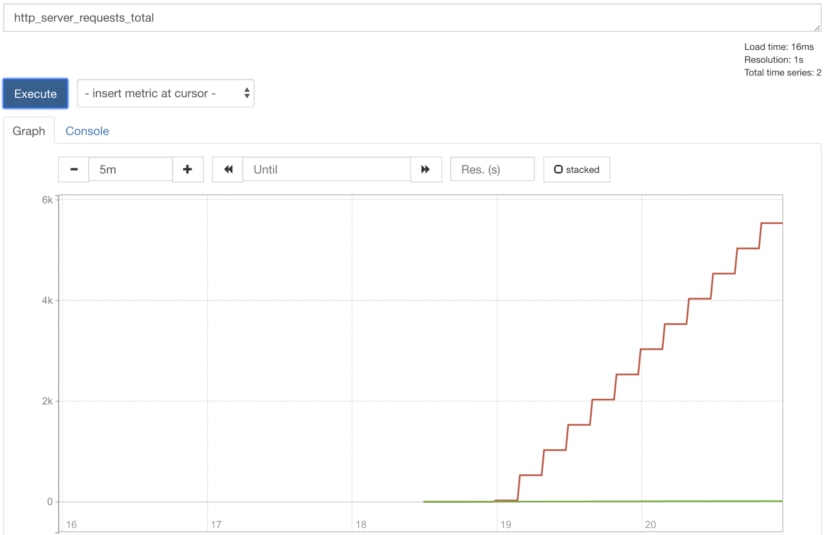
The problem with this query is that we are graphing a total, which is an ever-increasing value. Instead, we can query the rate of change over a period of time (in this case, over one minute):

This gives us a much better view of our system’s actual throughput. Now that we have the query we want, it’s time to get this information in another system that has more robust dashboard capabilities.
Exporting Prometheus metrics to AppOptics
The AppOptics host agent comes with support for directly scraping Prometheus metrics endpoints. This can be used to scrape any application with support for these endpoints, including Prometheus instances. However, we will scrape our Rails application directly and import the results into AppOptics.
Here’s our Prometheus configuration for the AppOptics host agent:
collector:
  prometheus:
    all:
      urls: |-
        http://localhost:3000/metrics
load:
  plugin: snap-plugin-collector-bridge-prometheus
  task: task-bridge-prometheus.yaml
After installing the agent with the correct configuration and enabling the Prometheus integration in AppOptics, our data shows up in AppOptics almost immediately:
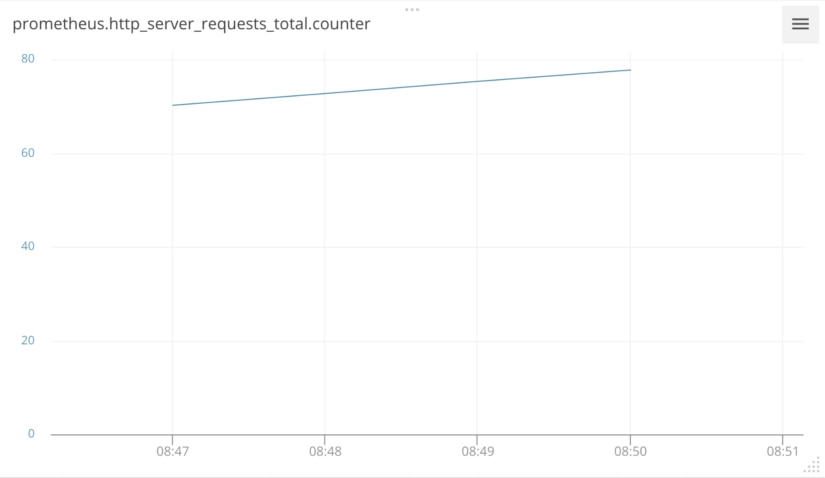
Here we are seeing the same data from our Prometheus query in AppOptics, which is a report of average requests per minute. It’s important to note that Prometheus is reporting raw counts. In order to get rate of change, AppOptics supports display transforms to convert these counts into a more useable format.
Now that you have a good idea how to export Prometheus metrics in AppOptics, take time to check out the many other features of AppOptics that can help you troubleshoot problems faster. It includes support for APM metrics, distributed tracing, and more.
The SolarWinds and SolarWinds Cloud trademarks, service marks, and logos are the exclusive property of SolarWinds Worldwide, LLC or its affiliates. All other trademarks are the property of their respective owners.