Act 1: The database faces a critical issue
Monday mornings are often bad for operations teams, just like Friday afternoons—things tend to go wrong at these times. You’ve just arrived in the office and already know there’s an issue, because you received an alert on your phone.
As you walk in, you see a crowd near the operations team desk. The web application has been down for the last hour and the team looks confused and stressed. You hear the word “database” uttered a few times. You’re the sole DBA on the team, but no worries: you know where to look first.
Before you can log in, you realize your boss is looming by your desk. “The system is down,” he says, as if it’s your fault. “Can you check the database?”
“I know,” you say with confidence, “just about to find out.” If you can find the root cause, you’re on the way to getting things up and running again.
Act 2: Narrowing down the problem with monitoring
You feel at ease. Your company has been using SolarWinds® AppOptics™ for a while. It’s a Application Performance Monitoring (APM) and infrastructure monitoring solution that your team used to figure out the API calls were timing out due to slow database performance. You’ve also been using AppOptics to monitor the database cluster running in AWS.
You check the alert you received on your phone and it says the application is timing out. To identify why, you look into the traced calls with high response times:

You also see that the issue is indeed the database, because the MySQL span is using up 98% of the request time!
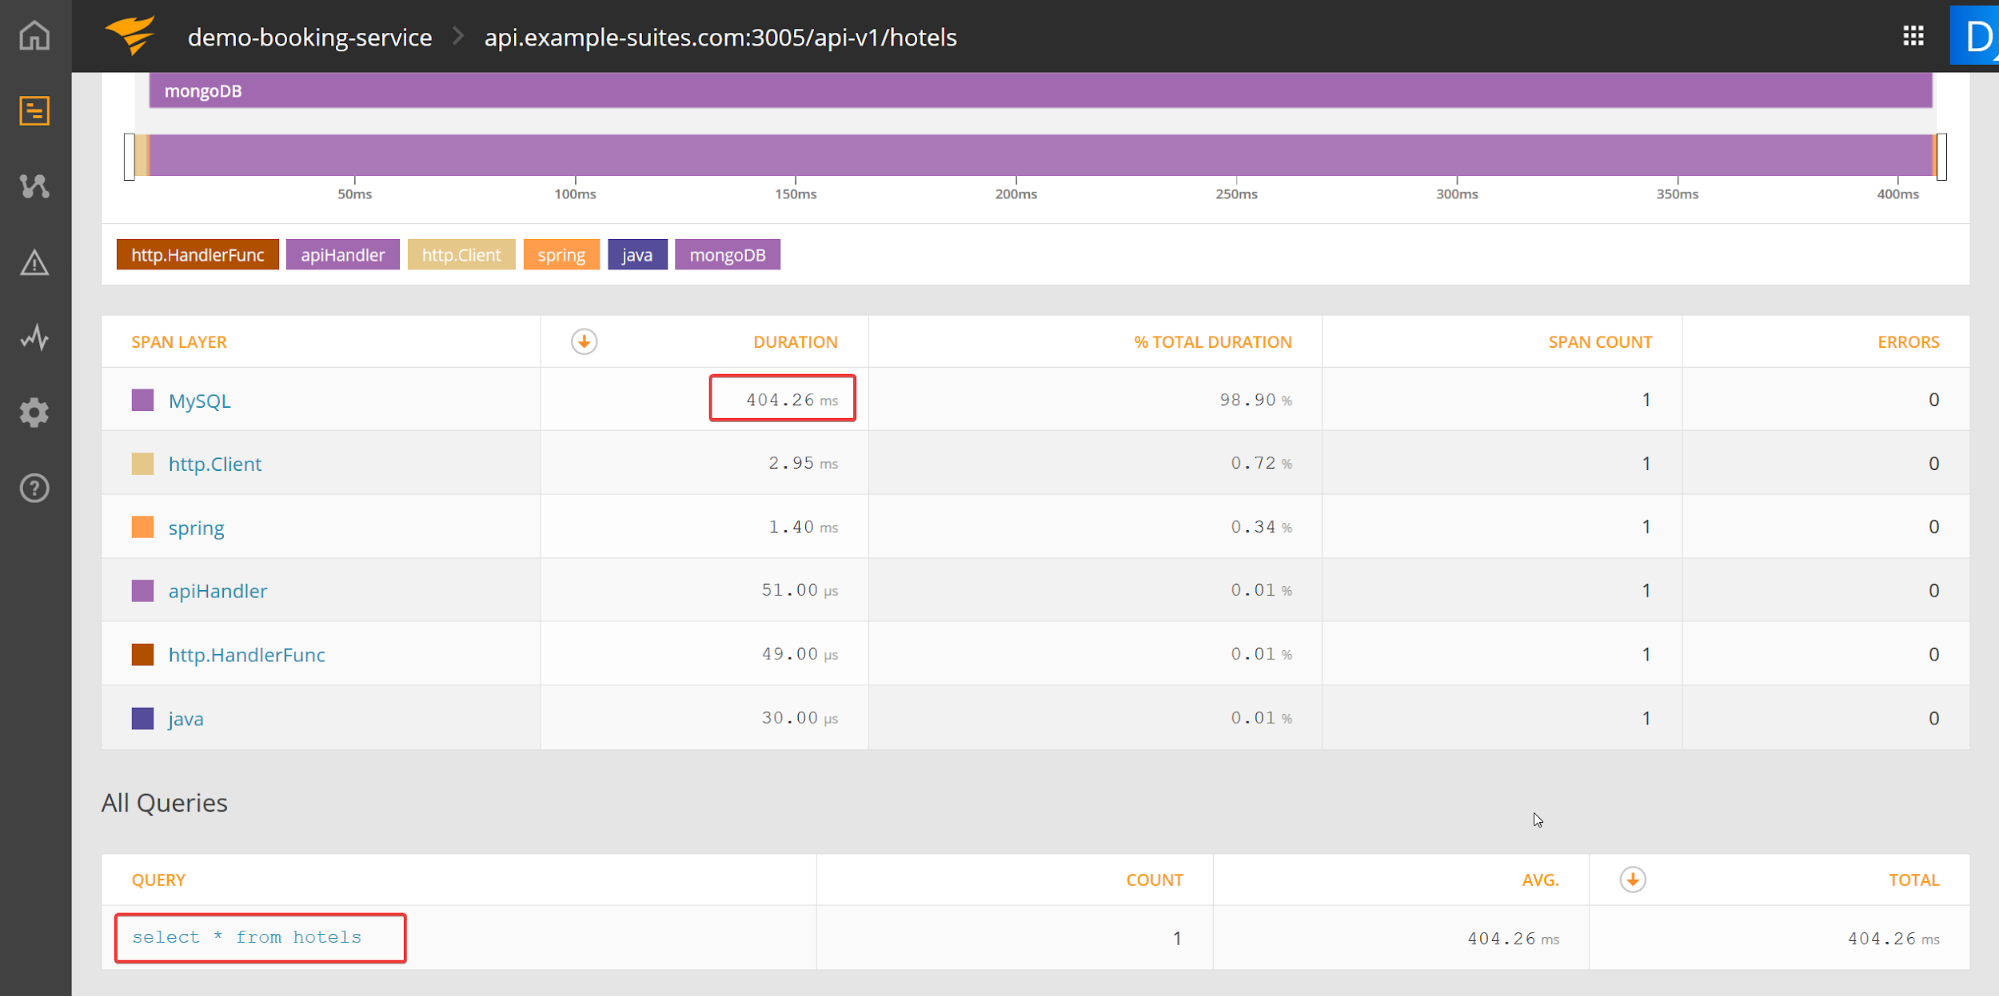
Next, you bring up the database dashboard you look at every morning before your first coffee. The picture looks something like this:
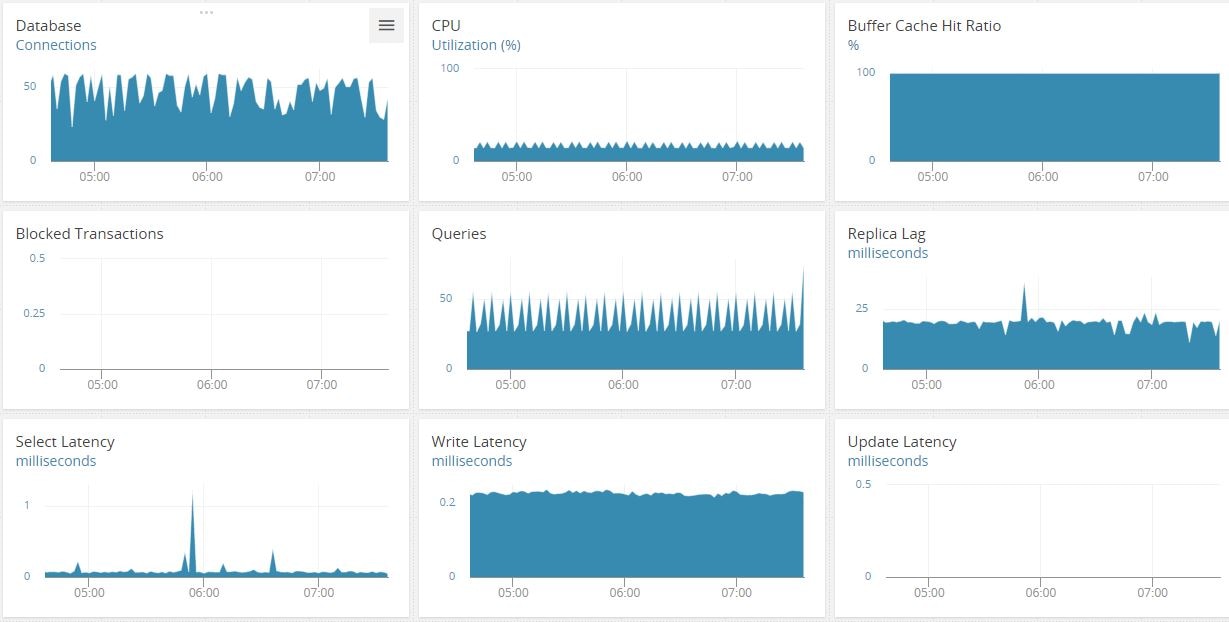
You start to think about what the dashboard tells you:
- The CPU isn’t spiking—that’s good.
- The number of connections is extremely high—from your experience, you know they’re usually in the region of five to six, all coming from the app server.
- There are no blocked transactions. But again, the number of queries is high—and they’re in a sawtooth form, meaning some sort of repeated query is hitting the server.
- Replication lag is high (20 milliseconds). This likely means a write operation is holding the master node and the replica is struggling to keep up.
You’re starting to close in on the root cause. Having the right database monitoring tool in place helps significantly reduce the time it takes to get to the root cause.
Monitoring MySQL metrics
Given the complexity of the product, you know there are factors that can affect a MySQL database’s performance, including configuration parameters, database design, the machine’s spec, the queries running, and more. That’s why you decided to make database monitoring a priority from the start—it’s one of a DBA’s core duties. You wanted to stay ahead of the game. You wanted to know how your databases were doing at any time.
Which MySQL metrics should be monitored?
So, how did you start monitoring MySQL?
To start, you had to look at the underlying platform. You’ve been managing a whole fleet of MySQL instances for the last couple years. Some run on EC2; others, like the new app backend, are on RDS. Some instances are plain-vanilla MySQL, a few are MariaDB, and lately everyone seems to be using Aurora.
RDS MySQL exposes a different set of metrics from an EC2-hosted one, so you decided to build two sets of monitoring dashboards: one for RDS, another for EC2. RDS exposes its metrics through CloudWatch, and they’re pretty much the same for any RDS database engine. MySQL Aurora exposes some extra metrics. You enabled enhanced monitoring for all RDS instances because it exposes some extra metrics.
A dashboard can get cluttered with metric graphs quickly, so you chose the most important ones—graphs that give an immediate picture of the system’s health.
Here’s what you decided to include:
- CPUUtilization indicates whether the RDS instance is under CPU pressure.
- DatabaseConnections shows the active DB connections against your instance and gives a good picture of how busy it is.
- ReadLatency indicates the average time in milliseconds to perform a read operation.
- WriteLatency shows the average time in milliseconds to do a write operation.
- DiskQueueDepth reveals the number of disk IO requests waiting at any time.
- fileSys.usedPercent, an enhanced metric, shows the percentage of the file-system disk space in use.
- memory.free, also an enhanced metric, shows the amount of unassigned (free) memory in KB.
For the Aurora instances, you chose to include these metrics:
- Queries reveals the average number of queries executed per second.
- BufferCacheHitRatio shows the percentage of queries that can be served with data already stored in memory. Ideally, this should be 100 or close to that.
- SelectLatency indicates the average time in milliseconds to perform a SQL SELECT query (not the same as ReadLatency).
- InsertLatency shows the average time in milliseconds to perform a SQL INSERT query (the same as WriteLatency).
- LoginFailures indicates the average number of failed logins attempts per second.
Once the RDS metrics were chosen, you decided to make a list of EC2-hosted MySQL metrics.
This posed an interesting scenario. EC2 exposes its own set of counters through CloudWatch, and MySQL exposes many metrics of its own, not through CloudWatch. Which ones should you monitor?
In the end you decided to take metrics from both sides:
- CPUUtilization, a CloudWatch metric, shows the CPU status of the EC2 host.
- VolumeQueueLength, a CloudWatch metric, indicates the number of IO requests waiting for each EBS volume.
AppOptics is also designed to gather its own metrics from the Linux-based EC2 instance it monitors. From there, you added two more:
- disk.percent.free shows if any of the EC2 volumes are running out of space.
- mem.percent.free indicates if the box is under memory pressure.
Finally, the native MySQL metrics:
- Threads_connected shows the total number of active connections to the instance.
- Slow queries indicate the number of queries that took more time to complete (in seconds) than what’s defined in the long query time system variable.
- Aborted_connects shows the number of failed attempts to connect to the database server.
- Queries gives the number of SQL statements executed in MySQL at any one time. Its average value over time can be an indication of the system’s throughput.
- Innodb buffer pool read requests reveals the number of read requests to buffer pool.
- Innodb buffer pool reads gives the number of read requests buffer pool couldn’t satisfy.
Calculating this metric as a percentage of the Innodb buffer pool read requests can show how efficiently the buffer pool is being used.
Getting everything into AppOptics
Once you decided on the metrics, it was easy for you to start monitoring them from AppOptics. You simply:
- Selected ELB and RDS CloudWatch metrics to import from your AWS account.
- Created the dashboards.
- And finally, set up the alerts.
Act 3: Finding the root cause
Your mind snaps back to present. You decide to check when this all started. Moving back through the time window in the dashboard you see the problem started around 11:45 p.m. the night before:
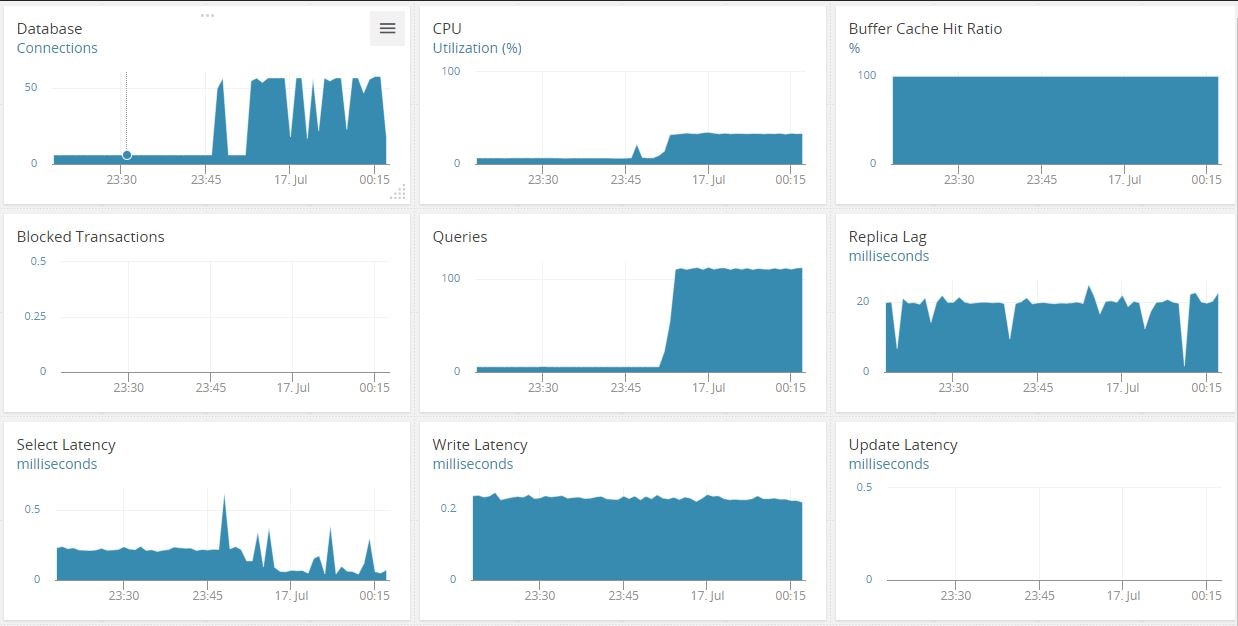
You know there’s a nightly batch job that starts shortly before that. It’s not a particularly stable application, and sometimes it’s been known to lock down the database. You decide to look at the connections hitting the server:
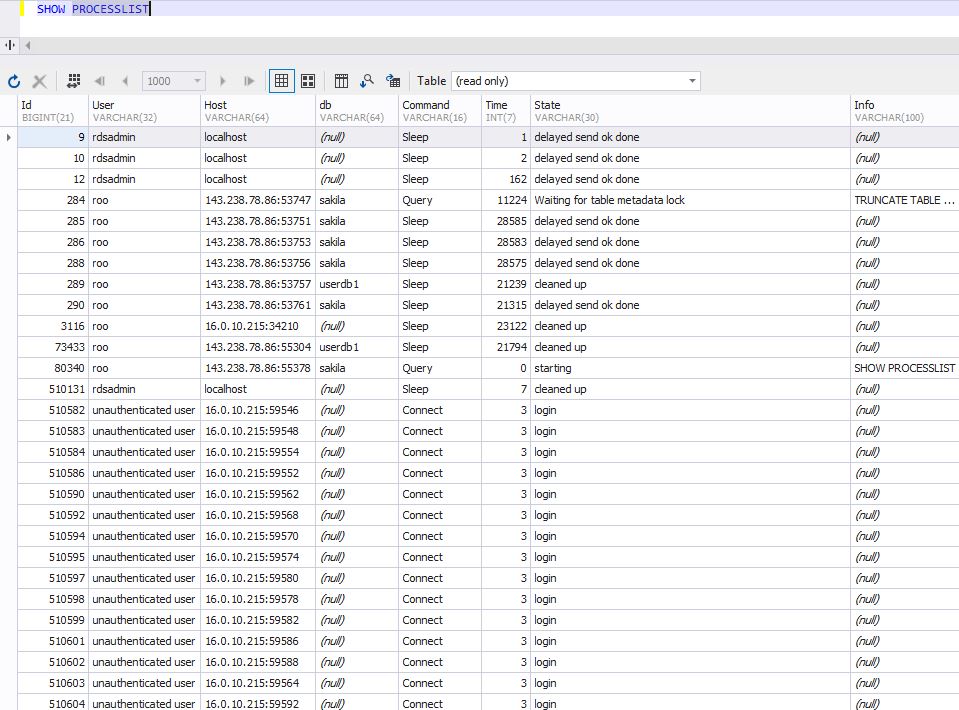
Just as you suspected! Several connection processes were coming from the same address as “unauthenticated user.” The app failed the authentication phase, timed out, and kept trying. In this case, there were multiple threads hitting the server. This kept it so busy it was unable to respond to queries quickly.
The operations desk guys call the business unit to ask if the app can be killed. They agree. Within a few minutes, performance returns to normal.
Epilogue
This was just an example, but it illustrates many of the advantages SolarWinds AppOptics can bring to the table when troubleshooting MySQL performance issues. First, it can monitor application and infrastructure performance in a single pane of glass. Its tracing capability can allow you to identify the cause of MySQL performance issues in your app, including database problems, whether these databases are in RDS, hosted in EC2, Dockerized, or on-premise. It’s possible to mix and match database metrics (not just MySQL) from all these platforms in the same dashboard, something you can’t easily do with CloudWatch which specializes in AWS metrics. That’s one of the things that makes AppOptics worthwhile. You’re happy you signed up for a free trial months ago.
With this problem out of the way, you plan to spend more of your time working on optimizing your applications and infrastructure instead of fixing them. Now if you could just identify the root cause of your empty coffee cup…
The SolarWinds and SolarWinds Cloud trademarks, service marks, and logos are the exclusive property of SolarWinds Worldwide, LLC or its affiliates. All other trademarks are the property of their respective owners.