Note: This article was originally published on Librato, which has since been merged with SolarWinds®AppOptics™. Learn about the AppOptics add-on for Heroku apps.
This is a guest post written by Mathias Meyer of Travis CI.
As you scale out applications on Heroku, collecting metrics becomes an interesting challenge. With an ever-growing amount of different apps, running across multiple dynos, in an effectively stateless environment, there are several ways to collect and aggregate that help work around these constraints.
In this article, I’m presenting a few ways of collecting and aggregating metrics on Heroku with a focus on Librato Metrics, which is what we’re using. The general means, though, are applicable to any aggregation service or tool.
Travis CI started out by collecting metrics in every process and then having all of them dump the metrics into the logs in regular intervals. This was thanks to to SolarWinds® Papertrail™, and the way you could have searches filter log streams automatically, extract certain log lines, and forward them to a webhook.
Logs as Streams of Metrics


This was our initial approach to collecting and aggregating metrics. It’s very simple and uses an existing transport to get them to their final destination.
Every metric is aggregated into rates, percentiles, means and medians, and collectively dumped to stdout every 60 seconds. The metrics data was tagged specifically in the logs and went through Papertrail, where we had a filter set up to collect and aggregate the metrics in a custom webhook, which then would export the data to Librato Metrics.
However, with our API alone, running across seven dynos with four sub-processes each, the log volume became enormous. The metrics started hiding more important information with all their noise.
To give you a hint, since we moved our metrics off the logs, our overall log volume has gone down by some 25 GB per month.
Standardized Metrics Into Log Streams With l2met


The Heroku router has an interesting approach to solve this problem. Rather than log metrics in intervals, every log line for a request includes the metrics. Here’s an example:
at=info method=GET path=/yui/yuidoc.png?branch=master
  host=api.travis-ci.org dyno=web.6 connect=2ms service=38ms
  status=200 bytes=2152
It logs milliseconds for the time it took to connect to a dyno and how long it took the dyno to process the request.
Based on this approach, the idea for l2met came about—a standardized format to track metrics in logs. With l2met, you can include measurements or counts together with your logging, similar to the Heroku router model above. That makes it easy to log useful things (hint: use the key value format!) and annotate them with how long it took or how often they happened.
Say you have a request that triggers a background job. You could log a line stating the user’s login, the type of job, and how long it took to queue:
user=roidrage job=synchronize request_id=adf8338a
  measure#job.synchronize=12ms
That’s a pretty neat way to augment logging data with useful metrics. Data can easily be aggregated into number of requests per second and into a timer to track average and percentile values.
Librato, where we aggregate our metrics, has a neat integration with Heroku that automatically sets up endpoints for the Heroku Logplex, so that they automagically aggregate your custom metrics.
Beyond that, they also aggregate your dyno runtime metrics, PostgreSQL metrics, and the router metrics. If an addon provider logs their own metrics, like CloudAMQP does, they’ll also be aggregated.
The l2met format lends itself nicely when metrics in your system are tied to events that produce log output. On the other hand, if you’re tracking several metrics on their own, without specific log events to go along with them, that can become unwieldy as your application grows, as the signal of the logs drowns in the noise of the metrics. You can filter them out, but it becomes a burden every time someone runs hk logs to tail logs. In Papertrail that’s generally easier, as you can set up a pre-filter that ignores messages with metrics in them.
What Is StatsD?

StatsD is the tool of choice when it comes to aggregating metrics from multiple applications, on multiple servers. Every process sends metrics via UDP, in a non-blocking fashion, and StatsD aggregates the metrics and sends them upstream, to Graphite, Librato Metrics, and tons of other providers.
It makes collecting and aggregating metrics very easy, but isn’t as easy to use on Heroku.
StatsD works best in a trusted environment, a closed network, where the sources for incoming metrics don’t require authentication. It’s even a handy tool to install on the same server as your application servers.
But on Heroku, sources can’t be trusted, as it’s a public infrastructure. You can’t just run a StatsD somewhere and have your applications stream metrics to it without the risk of other, untrusted sources poisoning your data.
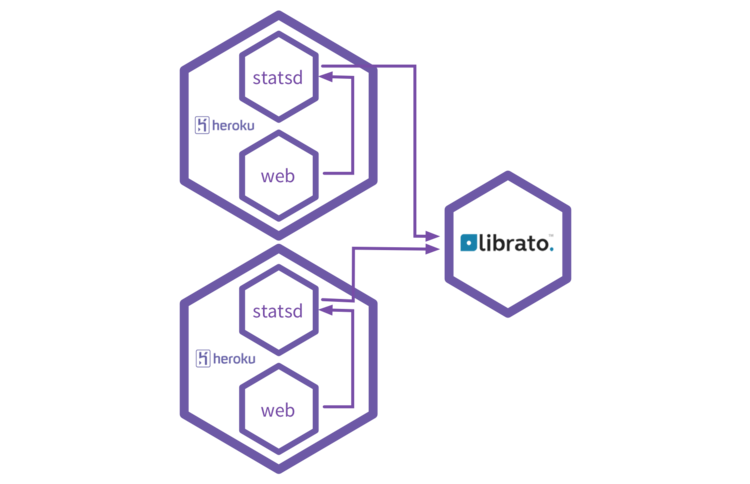
You can work around that by running a StatsD as part of every dyno, based on a custom buildpack, and have the application server simply report metrics to the expected port on localhost. It’s worth noting that the extra resources needed by the StatsD process are chewed off your application’s memory, so it’s a trade-off in terms of memory usage and CPU usage.
This turns out to be quite a neat option too. Thanks to Heroku’s Dyno model, it’s quite easy to package a StatsD alongside your application and have it start as part of the Procfile. I’ve set up a little test project with a tiny Sinatra app, reporting metrics to a Dyno-local StatsD instance which in turn reports to Librato Metrics.
Aggregating Metrics in Librato Metrics

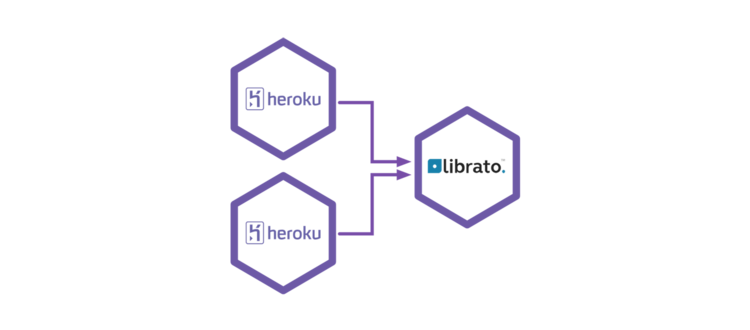
The last solution is to not use any intermediates and report metrics directly to the collector, in our case, to Librato metrics. But with the dynamics of Heroku dynos, there’s the problem of identifying processes. Librato uses a means called sources to determine a server metrics are streamed from. A source can identify a server, or a process running on a server.
As dynos change hostnames as applications are deployed and dynos are restarted (automatically every 24 hours), that can turn into a mess of an abundance of metrics sources.
Last year, Librato shipped a great new feature called service-side aggregation.
When multiple processes report the same metrics from the same host using the same metrics, you can see flapping metrics, not making much sense as long as both processes are running. When you enable aggregation for the shared metrics, Librato aggregates the metrics for the same source into a single stream before storing it. That makes it easier to handle metrics not just from two processes, but also different servers running the same application.
You can do some neat things with this. First up, and this is what we’re currently doing, you can aggregate metrics streamed from multiple processes on multiple dynos into a single source. For instance, all metrics coming from the API dynos would be aggregated into a single source.
The downside is that you lose information detail. Possible peaks on single dynos can get lost in the average calculated over all of the metrics. If you do see a spike, it’ll be hard to determine if only one of the dynos is affected or all of them.
So you could break it down further, using the dyno name. It just so happens that Heroku exposes the $DYNO environment variable, which you can add to the source name. A single API dyno, rather than just use api as the source, could become api.web.1 (by using “api.#{ENV[‘DYNO’]}“).
You could move down even further than that and attach the process identifier to the source, giving you metrics down to the process. While this gives you even more detail, it also increases the noise in the data. With the process identifier a part of the source name, you’ll see a lot more different source names pop up.
It’s a tradeoff between increasing visibility and adding more noise. On Heroku, you have little control over the processes running in a single dyno. But tracking metrics per process could allow you to isolate spikes even further than that, possibly pointing to a problem in the application rather than just a global issue.
Which One is Right For Me?
Simplest means to get started, if you’re using Librato on Heroku, is to dump your metrics directly into the logs and have Librato collect and aggregate them for you. This makes sense if what you mostly log is requests or single events where you can attach the time as another logging value.
As the noise increases, you can consider either bundling a StatsD in your dynos, or you can have a separate thread report your metrics directly to your aggregation tool of choice. What’s the advantage of either? With StatsD, you’re only burdening your application with collecting the metrics, then sending them off right away immediately. This can help reduce complexity inside the app but trades it for complexity inside a single dyno. Two processes where logically only one is running (the dyno) can be harder to debug when there are issues.
Collecting and pre-aggregating in your application directly increases its workload. While all that can be done in a different thread, the application needs to collect and flush metrics and regularly send them upstream to be aggregated. Your application is also bound to handling connection errors to the upstream service. With a prolonged downtime, there’s a risk of overutilizing available memory with the backlog of metrics.
But from the overall setup, reporting directly from your application has the least complexity. That’s why it’s currently the favorable one for us.
We’ve been using our logs for the longest time, but with thousands of metrics, it’s gotten unwielding to manage. Most of our processes by now report directly to Librato, currently only sharing a single source name per application, but we’ll soon be diving deeper by using the $DYNO value to track metrics per dyno.
To learn more about how you can collect metrics in general, beyond using Heroku, Librato published a great post on collector patterns—the different ways you can use to collect your metrics and get them into Librato.