Note: This article was originally published on Librato, which has since been merged with SolarWinds® AppOptics™. Learn more about monitoring application performance using AppOptics.
In my work as an Integrations Engineer at Librato, I find myself dabbling in many of our codebases. In the last few months, I’ve worked in Ruby, JavaScript, Python, Go, and Java projects. Having used Vim for over ten years, my instinct was to continue using it when working in all of these projects. It didn’t take long to change my mind, and here is why.
First Steps
Using Vim feels to me like speaking a native language. I figured I could configure and modify Vim to the point of being as productive as my Java-writing colleagues are with IntelliJ IDEA. But when said colleagues found out that I was planning to write a guide for how to make a happy Vim setup for working with Java, they rebuffed me: “You should really spend your time learning how to use IntelliJ IDEA.” I was reluctant at first—IDEs feel like big, hulking, slow programs. Besides, I don’t want the editor to do things for me—after all, I can “edit text at the speed of thought” with Vim. However, I had to admit that using an IDE has certain advantages.
Why IDE
The IDE actually understands my Java code. It can refactor my code, automatically declare things, add missing imports, and so forth. Vim can’t do this (well, not without calling out to Eclipse behind the scenes). Additionally, the Librato data team possesses a wealth of IntelliJ expertise that I can lean on for support.
So, after installing IdeaVim for Vim emulation, and setting up the Solarized light theme, I got started. Here are my impressions.
Highlights of my experience so far
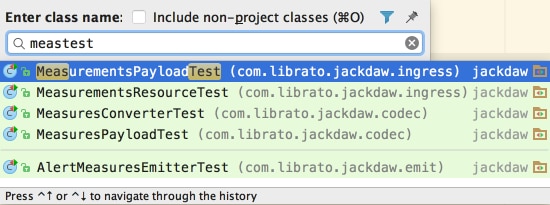
In Vim I use ctrlp.vim as a fuzzy file finder: type “meastest” and the plugin produces a list of matching files, helping me quickly get to the file MeasuresConverterTest.java. IDEA has something a bit smarter: go to class (⌘O). Unlike a fuzzy file finder, this allows me to find classes or interfaces that are nested within outer classes, even if I don’t know the name of the file they’re contained in.
Jump to Definition
Rather than having to set up exuberant ctags for the project, with IDEA this analysis is done automatically. And thanks to IdeaVim, the standard Vim binding for jumping to definition, ⌃], works as expected. After jumping to a definition, jump back to your previous position with ⌃O (remember “o” for “older”). Jump forwards again with Tab. Although IDEA doesn’t support the full jumplist concept from Vim, this covers most important jumplist use case for navigating a codebase.
Working with Java, where the use of inheritance and interfaces is common, sometimes I want the reverse of “go to definition”: given an interface, jump to a particular implementation. With ctags I’m out of luck here, but IDEA supports this. I’ve mapped g] (a mnemonic for ⌃]) to “Go to implementations”, which opens a menu showing the implementations of an interface.
Another great thing about Jump to definition in IDEA is that, without any additional work on my part, it works with standard library classes and my project’s dependencies. This always requires extra setup work with Vim and ctags.
The Test Runner
When running the test suite in a Ruby project, I’m accustomed to seeing the orderly march of dots indicating each (hopefully) passing test. In our Java projects, however, we get reams of text output, with the stacktraces for any failures somewhere in the middle. Running our tests from within IDEA offers one solution to this problem. To set this up, right-click the test/src/java directory in in the project tree, and choose “Run ‘All Tests’”. Subsequently, you can run the suite with ⌃⌘R. Even better, to shorten your feedback cycle, you can re-run only the tests that failed in the last run with ⌘R.
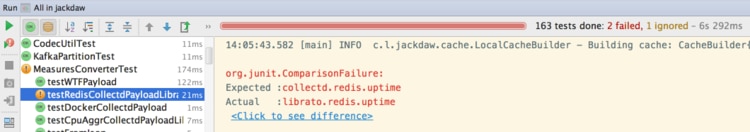
 IDEA helps make sense of the test output by breaking down the suite into its hierarchy of classes and test cases. Failures are easy to read, and for assertEquals failures, the built-in diff viewer can be handy. Best of all is the ability to navigate from failure to failure using ⌘⌥↓ and ⌘⌥↓. As a Vim user, this kind of keyboard navigability is key if I’m going to use a GUI program. The icing on the cake is that this is the same keystroke for navigating through build failures or ‘Find in Path’ (project wide search) results.
Customizing IdeaVim
In IDEA, every editor action can be referred to by an ID. With IdeaVim you can view this list by running :actionlist and invoke an action using :action ActionName. For example, to select all text run the $SelectAll action using :action $SelectAll. This makes it easy to create mappings in the Vim way. The implementation for my aforementioned g] shortcut is:
nmap g] :action GotoImplementation<CR>
This means: “in normal mode, when I press g], run the GotoImplementation action (and hit enter).” I add this mapping to ~/.ideavimrc and I’m good to go. Note that IdeaVim doesn’t truly support VimScript, but it emulates it for the purposes of configuring mappings.
Closing Thoughts
Getting to know IntelliJ IDEA has been a positive experience. My initial reluctance to use a “heavyweight” tool turned out to be unfounded. While IntelliJ IDEA may use more memory than Vim, in practice I don’t think I’ll be any slower with the IDE, now that I have my footing. While I do think it’s possible to create a powerful and productive Java development environment in the Vim we know and love, getting to that productive place is faster with IDEA and IdeaVim. Stay tuned for a post by Larry Marburger on making use of all the powerful refactoring and automation features in IntelliJ.