Note: This article was originally published on Librato, which has since been merged with SolarWinds® AppOptics™. Learn more about monitoring application performance using AppOptics.
The name Redis is derived from the phrase “REmote DIctionary Server.” The project is open-source, and is one of the most popular key-value databases in use today. The Redis dataset is stored entirely in memory, which allows it to function exceptionally fast, and the data is written to disk periodically to support persistence of the data if the memory is lost.
When using Redis as a data source for an application, it is important to ensure that the service remains both healthy and stable. The best way to do this is by developing and instituting a comprehensive monitoring plan. Development of such a plan and its implementation is the topic of this article. We’ll discuss what key metrics should be included in the plan and why, and we’ll conclude with a walkthrough of how to configure Redis to report its metrics to Librato, and how to view those metrics through a custom dashboard.
Developing a Solid Database Monitoring Plan
Data is at the heart of any business, and the type of data, its importance to the company, and volatility are key factors when deciding what data source to use, and how comprehensively it should be monitored.
When developing a database monitoring plan, the first step is to identify the key areas which need to be monitored. As a general rule, you’ll want to ensure that you have insight into the following:
- Health of the underlying infrastructure
- Health of the data source and its processes
- Performance and success of queries being executed against the data source
- Conditions which are typically at fault when things take a turn for the worse
Let’s consider each of these individually and list some of the metrics that would be most helpful to ensure comprehensive coverage. This is not an exhaustive list but should provide a start to give a general view of how the database is functioning, and ensure adequate visibility into performance.
Monitoring Infrastructure Health
The performance of a database is inseparably connected with the performance of the underlying system. If the infrastructure which hosts it is unreliable, or inadequate for the task at hand, it won’t matter how performant and stable the database is—the system simply won’t be reliable. Conversely, deploying a database onto hardware which has resources well in excess of its needs will result in a stable platform, but will likely come at a significantly higher cost than required. Ideally, you want to pair your database with infrastructure that meets its needs, and then implement monitoring to ensure that both perform as expected.
When looking at infrastructure specifically, we want to pay attention to the following metrics:
CPU Usage
- It’s important that the processing power of the machine is being used—but ensure that it isn’t being maxed out constantly. This should be measured as utilization across all cores if using a multi-core machine.
Memory Usage
- As a memory-based data store, it is imperative that Redis has access to sufficient memory. Exceeding the amount will result in the use of swap space, and a drastic decrease in speed and efficiency.
Disk usage
- Redis data is periodically written to disk to ensure persistence. Additionally, space is required for logging, temporary files, and other supporting files.
Network Bandwidth
- This is a measurement of information flowing in and out of the machine.
Monitoring the Health of Redis Itself
This set of metrics is related to the health of the Redis Server itself. Essentially, the metrics are indicators that are used to determine if the server is running, and for how long it has been in that state.
Uptime
- This metric, usually measured in seconds, indicates the time the system has been running. This is useful in determining if the system has been restarted.
Connected Clients
- The number of clients connected to the database.
Blocked Clients
- The number of clients which have attempted connections, but failed. This could be due to the use of incorrect credentials, or an indication of a potential attack.
Monitoring Your Instance with Librato
The list of metrics above is a subset of those available to users of Redis. In order to view and analyze these in a meaningful way, we need the help of a visualization or reporting tool. This becomes even more important if you are using multiple Redis instances to support your applications. Librato is such a tool, and provides an easy way for the novice to monitor data, with the depth required for the production systems of a significant organization.
Before you start, you’ll need an account set up with Librato.
Installing the Monitoring Components
The first thing you will want to do in order to allow Librato to aggregate the metrics from the server is to install the agent on all instances. In order to do this, you’ll need to reference your Librato API key when setting up the agent. Log into your Librato account and navigate to the Integrations page.
![]()

Locate the Librato Agent integration, and click on it. It should look similar to the image below.
I used the Easy Install option when setting up the instances for this article. Ensure that Easy Install is selected, and select your Linux distribution. I used an Ubuntu image in the AWS Cloud, but this will work on almost any Linux server.
Note: Prior to installation of the agent, the second box on the screen below will not contain the success message.
Copy the command from the first box, and then SSH into the server and run the Easy Install script.
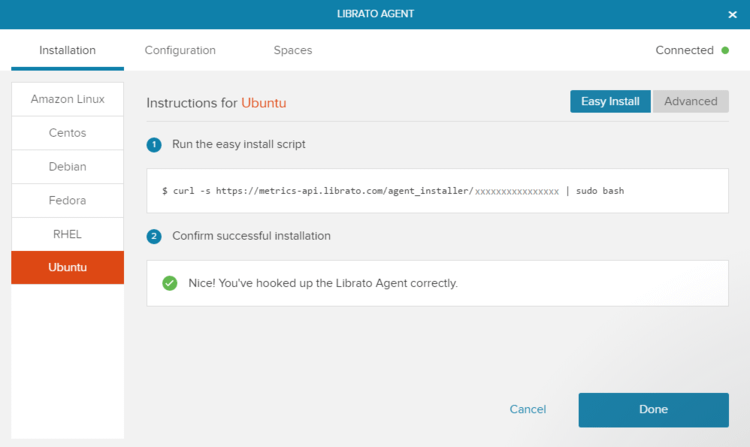
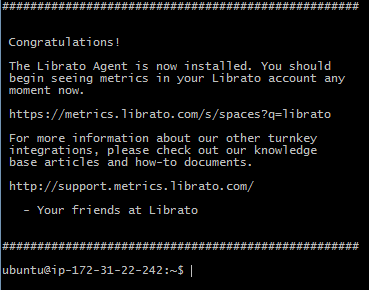
If the agent installs successfully, you should be presented with the following message on your terminal. The “Confirm successful installation” box on the Librato agent screen should look similar to the above, with a green checkbox. You should also see “Nice! You’ve hooked up the Librato Agent correctly.”
Configuring the Librato Agent
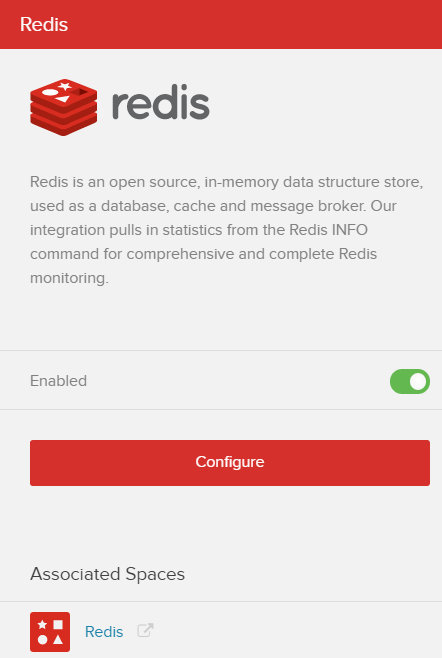
With the agent installed, the next step is to configure Redis to report metrics to the agent. Navigate back to the Integrations page and locate the Redis integration.
Click on the integration, and the following panel will appear. Enable the integration, and then click on the Configuration button. A second panel will appear with instructions on how to configure the agent on the Redis instance. The integration makes use of the collectd open source project. (Collectd is an open source project that provides a utility for collecting, storing and transferring performance information on the host machine.) Once these changes have been made, you’ll need to restart the collectd service for the changes to take effect, and your metrics will start flowing from the server into Librato.
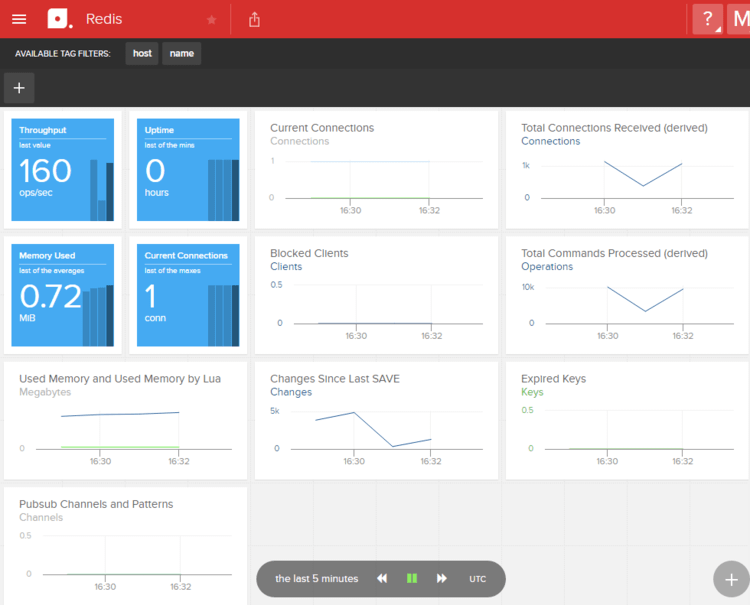
When everything is configured, either click on the Redis icon under Associated Spaces, or navigate to the Spaces page directly, and then select the Redis icon to view the default dashboard provided by Librato.
![]()

Working with the Redis Space
The default Redis Space provided by Librato offers many of the metrics listed above, related to the performance of the data source itself, and should look similar to the image below.
Now we need to add some additional metrics in order to get a full picture of the performance of our server. Unfortunately, you can’t make changes to the default space, but it’s really easy to create a copy, and then add additional metrics of your own. Start by clicking the “copy space” button at the top of the screen to create a copy.
![]()

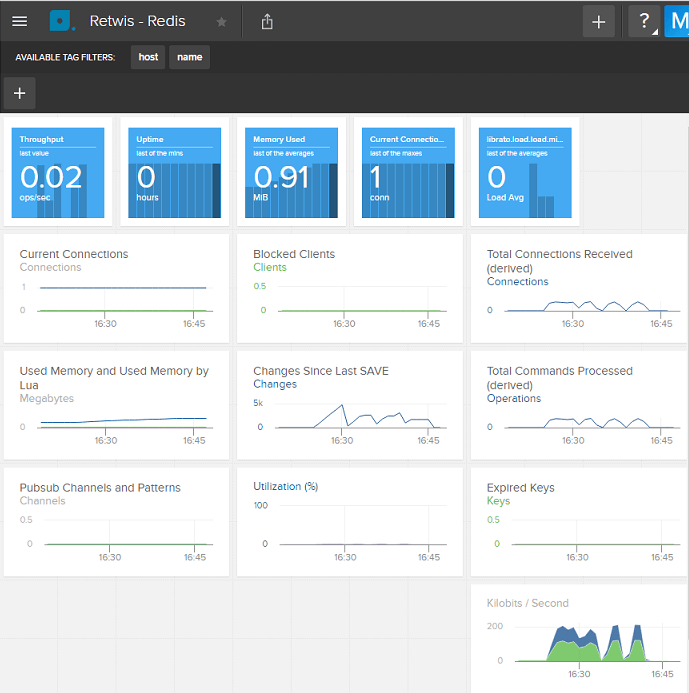
Create a name for your custom space. For this example, I’m monitoring an application called Retwis which uses Redis as its data store, so I’m going to call mine “Retwis – Redis.” It’s also helpful to select the “Open Space on Completion” option, so you don’t have to go looking for the new space after it’s created.
Alright, let’s do some customization. First, we want to ensure that we’re only monitoring the instances we need to. We do this by filtering the chart or space, and you can find out more about how to set and filter these in the documentation for Dynamic Tags.
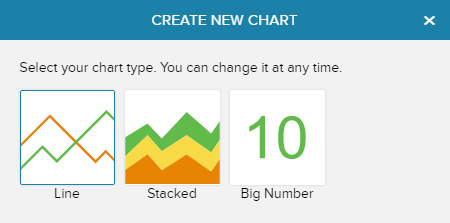
With our sources filtered, now we can add some additional metrics. Let’s look at CPU usage, network traffic, and load. Look at the bottom right of the space, and click on the Plus button. For CPU and Memory usage, let’s add a Stacked chart. We’ll add one for each. Click on the Stacked icon.
In the Metrics search box, type “CPU” and hit Enter. A selection of available metrics will appear below. I’m going to select AWS.EC2.CPUUtilization, but your selection may be different depending on the infrastructure you’re using. Select the checkbox next to the appropriate metric, and then click on Add Metrics to Chart. You can add multiple metrics to the chart by repeating the same process, but we’ll stick with one for now.
If you click on Chart Attributes, you can change the scale of the chart, adjust the Y-axis label, and even link it to another space, if you want to show more detail for a specific metric. When you’re done, click on the green Save button, and you’ll be returned to your space, with the new chart now added. Repeat this for network traffic. The metrics I’m going to use are AWS.EC2.NetworkIn and AWS.EC2.NetworkOut.
For load, I’m going to use a Big Number Chart Type, and select the librato.load.load.midterm metric. When you’re done, your chart should look similar to what is shown below.
Pro tips
- You can move charts around by hovering over a chart, clicking on the three dots which appear at the top of the chart, and dragging it around. Clicking on the menu icon on the top right of the chart will allow you to edit, delete, and choose other options related to the chart.
- To return to the dashboard after editing or adding a chart, click on the blue icon at the top left of the screen.
Beyond Monitoring
Once you have a monitoring plan in place and functioning, the next step is to determine baseline metrics for your application and then set up alerts which will be triggered when significant deviations occur. One such baseline which is useful to monitor is traffic. An unexpected change in the number of connections may indicate a broken connection between the data source and one of the applications using it.
If you do find Redis is running slow, there are few commands offered by Redis that can help diagnose the problem.
- https://redis.io/topics/latency for understanding why it’s slow.
- https://redis.io/commands/slowlog for finding slow queries.
- https://redis.io/topics/memory-optimization for helping set things up right.
To learn more about alerts, visit the Librato knowledge base, and view the documentation on alerts.