Note: This article was originally published on Librato, which has since been merged with SolarWinds® AppOptics™. Learn more about monitoring rails using AppOptics.
Many of our user-facing web applications are built on top of the Ruby on Rails framework. As you can probably imagine, we’ve put a lot of effort into instrumenting these applications so that we can keep a close watch on all aspects of their performance. In the process, we’ve learned a lot about getting metrics out of a Rails application.
Let’s walk through some of the things to consider when trying to instrument your own application.
What to Measure
Some of the things we might want to measure:
- Request Count – Total number of requests handled by the Rails app. This is useful as a general measure of site traffic.
- Total Request Time – Elapsed time between the request reaching the Rails app and a response being returned. This will be a good indication of how the performance of your application performance may be affecting user experience.
- Database Time – Amount of the total request time spent interacting with the database. This can help you identify problematic queries.
- Service Time – Amount of the total request time spent interacting with external services. Along with the database time, this likely accounts for a large chunk of your total request time.
- Template Rendering Time – Amount of the total request time spent rendering the view. Hopefully, this is a small portion of the request time (you don’t have any business logic in your views, right?)
- Queueing Time – Time a request spends between the app server and the Rails process. This is a common cause of hidden latency in your application’s overall response time.
- Error Count – Total number of errors raised that aren’t being handled by your application. This indicates that there may be problems with your infrastructure or the application itself.
- Status Code Counts – Count of requests that resulted in the different HTTP status codes. Much like the error count, a spike in 4xx or 5xx status codes may signal a problem in your application environment.
Obviously, this doesn’t even begin to cover all the things that you could measure, but it’s a good start and should give you a sense for the general health of your application. With a list of the things we want to measure in hand, the next question is: how do we measure them?
How to Measure
Rails has great support for filters which allow you to run custom code before, after or “around” any controller action. In fact, if you configure a filter in the ApplicationController it will be run on every action in your application. As a trivial example you might do something like this:
class ApplicationController < ActionController::Base
  around_action :collect_metrics

  def collect_metrics
    start = Time.now
    yield
    duration = Time.now - start
    Rails.logger.info "#{controller_name}##{action_name}: #{duration}s"
  end
end
The example above implements a basic “around” filter that will measure the execution time of all of the actions in your application. You could use a similar approach to collect most of the data that we identified previously. The good news is that there’s an easier way.
If you’ve ever watched the log output from Rails you’ve probably seen entries like this:
Started GET "/posts" for 192.168.0.102 at 2016-03-29 20:53:32 -0700
Processing by PostsController#index as HTML
  Post Load (0.3ms)  SELECT "posts".* FROM "posts"
  Rendered posts/index.html.erb within layouts/application (3.0ms)
Completed 200 OK in 16ms (Views: 14.0ms | ActiveRecord: 0.3ms)
From this, it’s pretty clear that Rails is already tracking and measuring all of the things that we’re interested in. What if there were an easy way to tap into that data so that we didn’t have to instrument it ourselves?
It turns out that all of the stats you see in the log output above (and lots more) are available by hooking into the ActiveSupport instrumentation API. Rails has defined a number of different events you can subscribe to with a custom listener. These events include things like the execution of controller actions (process_action.action_controller), the rendering of templates (render_template.action_view), and ActiveRecord queries (sql.active_record).
Subscribing to one of these events is as simple as registering a callback block:
ActiveSupport::Notifications.subscribe 'process_action.action_controller' do |*args|
  event = ActiveSupport::Notifications::Event.new(*args)
  Rails.logger.info "Event received: #{event}"
end
With each of these events Rails delivers all sorts of useful data (as part of the args passed to your callback):
- Name of the event
- Start and end time for the event
- Unique event ID
- Name of the exception class and the exception message (if an error occurs during the event)
In addition to the standard event data above, different events can provide a custom, event-specific payload. For example, the process_action.action_controller event provides all of the following data:
- Name of the controller
- Name of the action
- HTTP request parameters
- Request method (get, post, put, etc…)
- Request path
- Response format (html, json, xml, etc…)
- HTTP status code
- Elapsed time for rendering view
- Elapsed time for executing database queries
As you can see, almost all of the must-collect metrics we identified above are delivered to us as part of this one event.
If you’d like to learn more about the ActiveSupport instrumentation API, there is a presentation titled Digging Deep With ActiveSupport::Notifications you may want to check out.
What to Do With Your Measurements
We’ve considered some of the data that we would like to measure and the strategies you can use for collecting those measurements—now the question is, what to do with this data you’ve collected? At the very least, you’re going to want some way to visualize your metrics so that you can more easily see trends and/or anomalies over time. There are a number of ways to do this, but let’s see what it would look like if you use Librato.
Start by logging in to your Librato account and navigating to the Integrations page. From here click on the Rails icon and pick a name for your integration (using the name of your Rails application is a good choice). After clicking the “save” button, you’ll be presented with instructions for configuring your application:
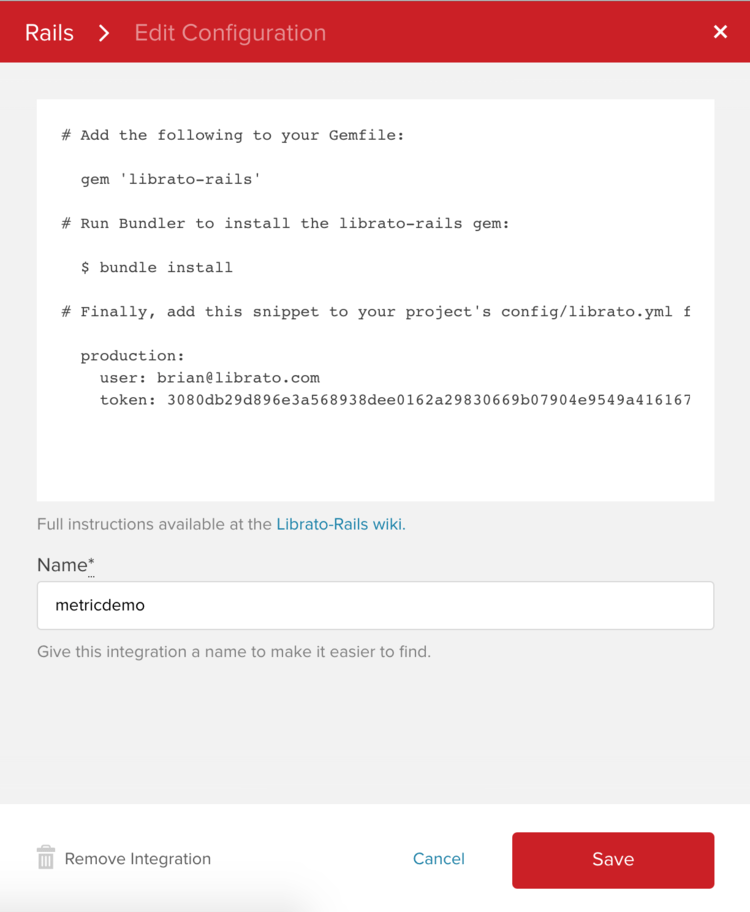
It’s as simple as adding the librato-rails gem to your application’s Gemfile and creating a librato.yml configuration file with your user and token.
Note that the librato-rails gem does most of the instrumentation work for you automatically—just having it present in your application is all that is required to collect most of the data we identified previously. The librato-rails gem works by setting up a Rack middleware and a bunch of ActiveSupport event subscribers (just like we discussed above). Each of those subscribers collect event data and send it off to Librato through our API.
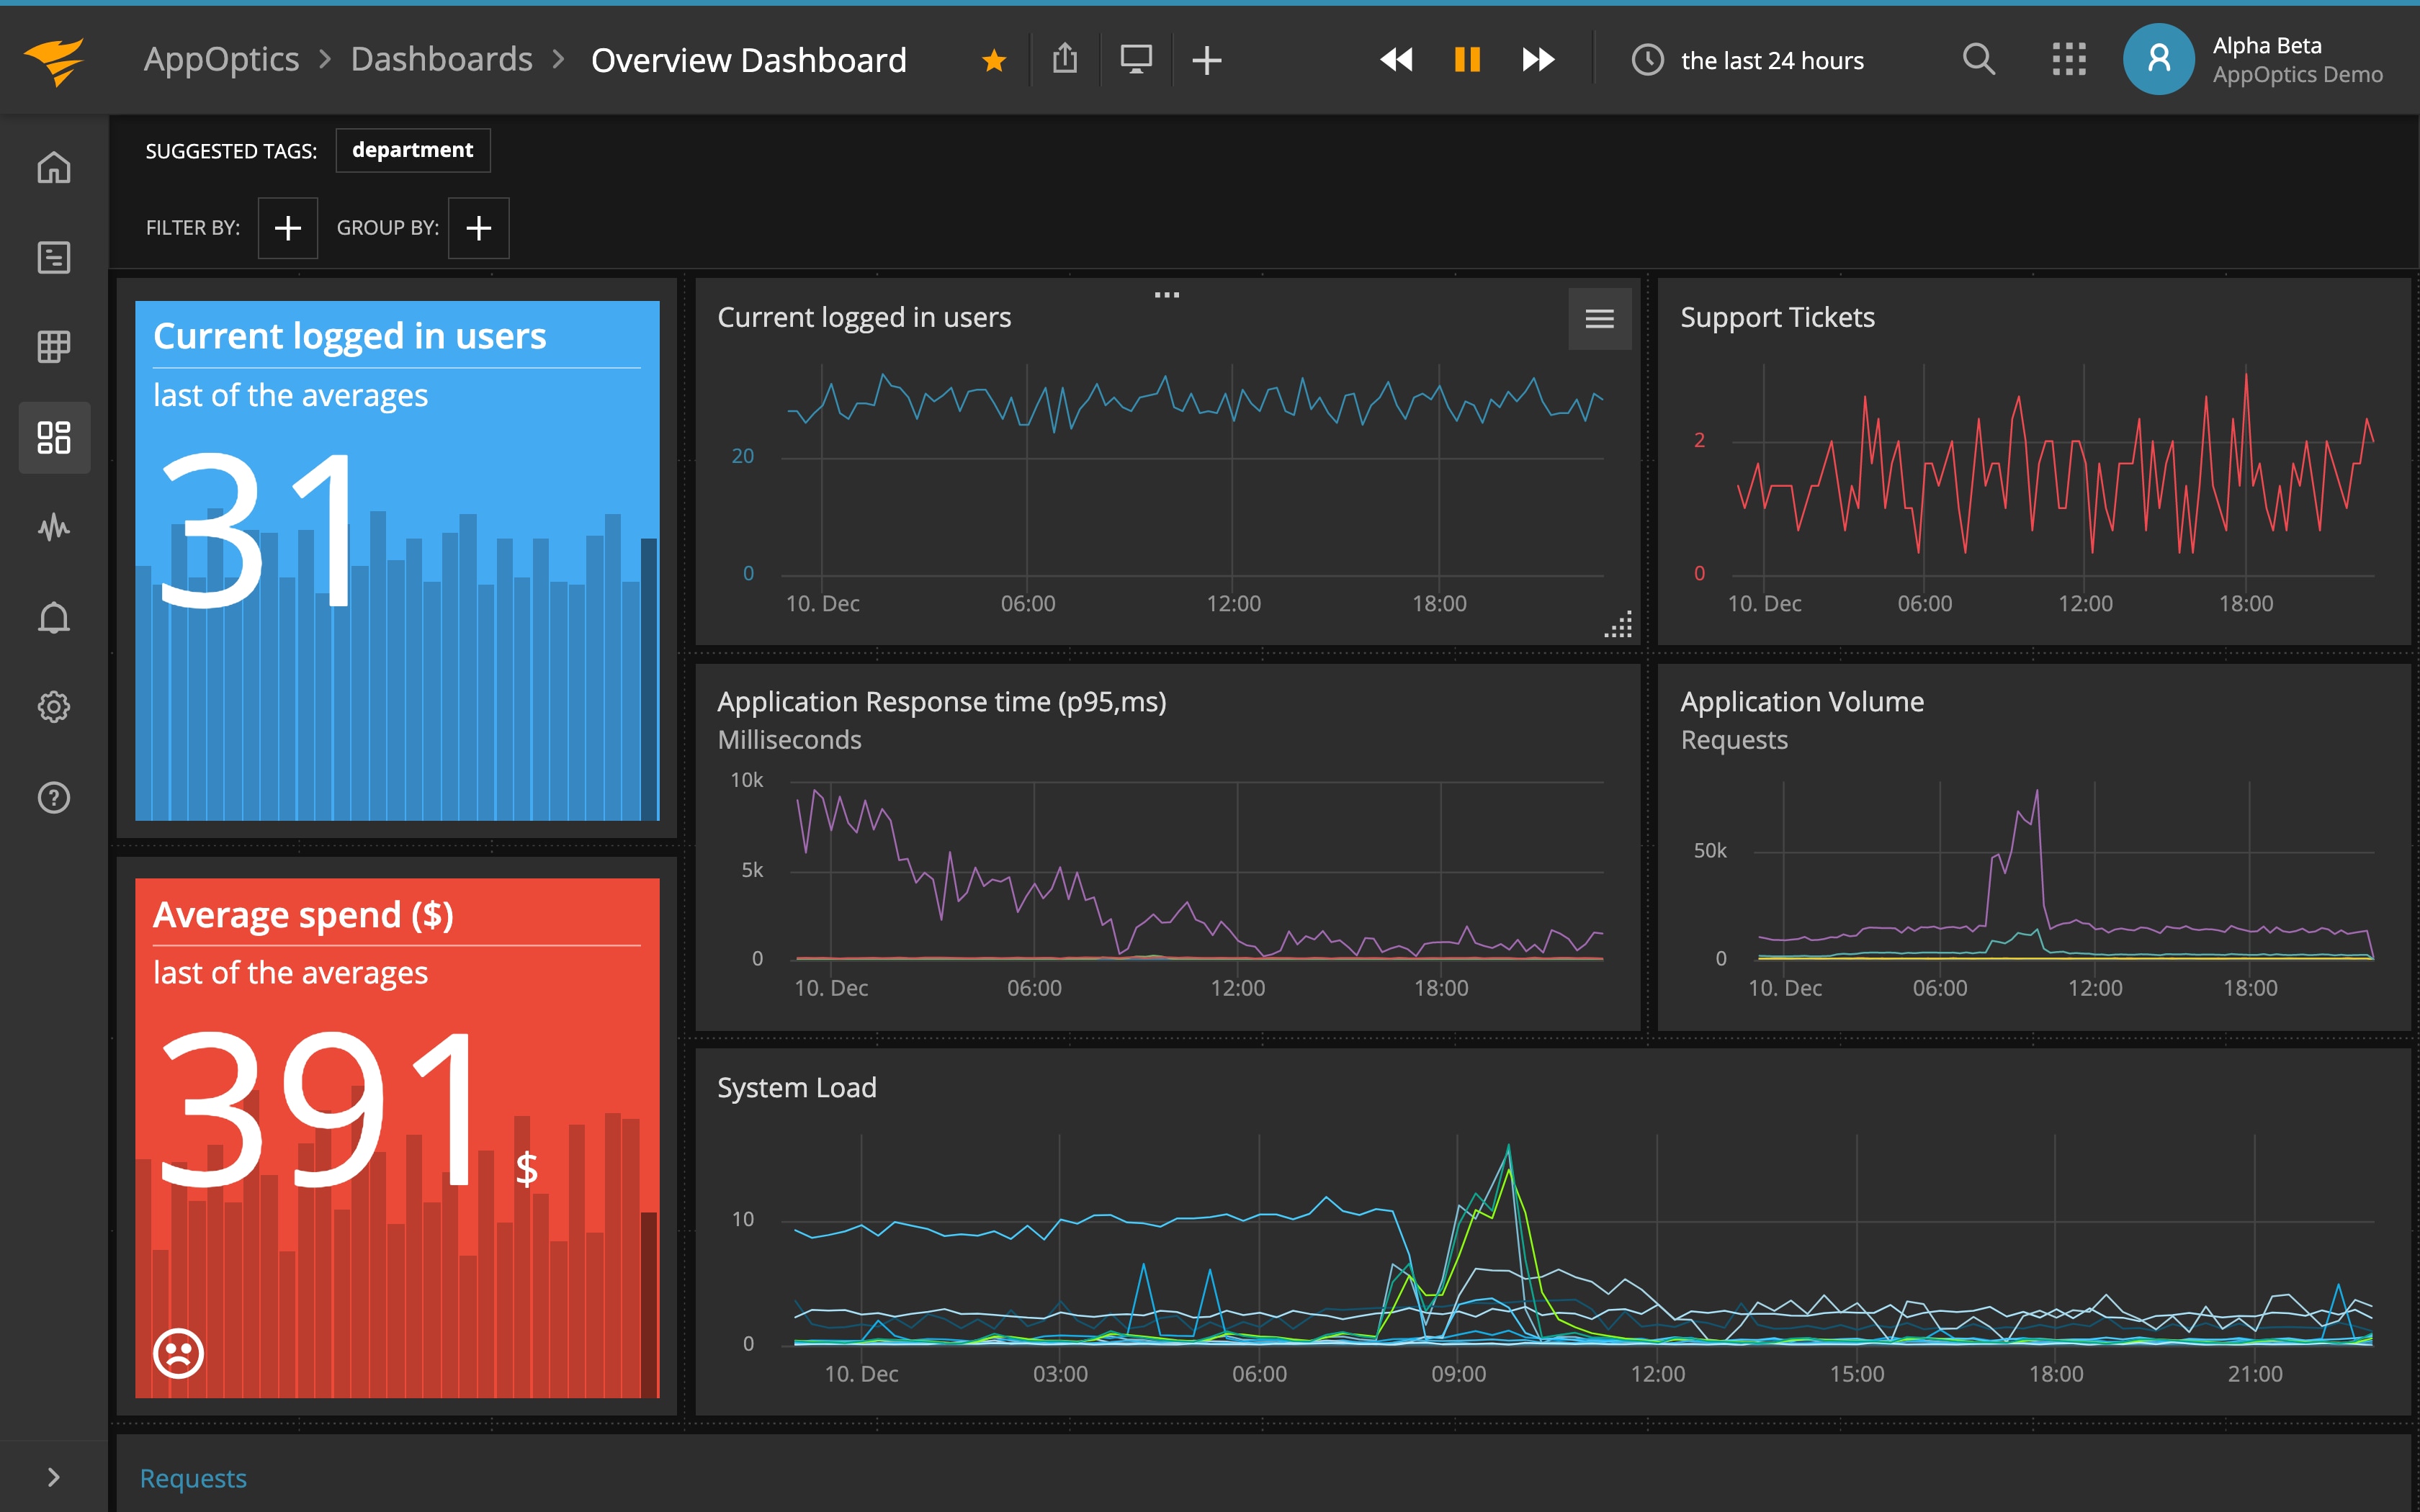
When enabling the Rails integration you also get two dashboards created for you automatically: one with Rails metrics and one with Rack metrics.
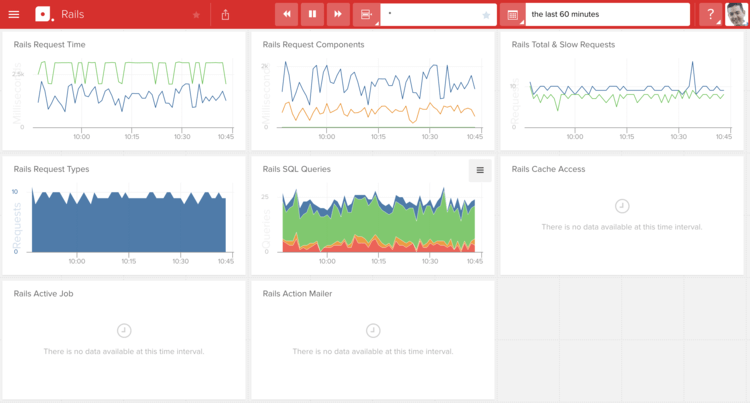
The Rails dashboard contains charts showing data on request counts, request timing (overall and broken-down by component), response codes, and SQL query types. If you’re using Rails features like Rails caching, Action Job, or Action Mailer you’ll also get some charts related to those features.
Note that the librato-rails gem reports more than 50 metrics by default (potentially a lot more given that a separate metric will be reported for each distinct HTTP response code returned by your application), so the charts on the Rails dashboard are just a small sampling of the data you can visualize.

The Rack dashboard contains some charts similar to those present on the Rails dashboard. Note, however, that the Rack metrics are measured from a point higher in the stack than your Rails application and will take into account the behavior of all of the Rack middleware that you are running.
For example, here is what the Rack middleware stack looks like for my sample application:
$ rake middleware
use Librato::Rack
use Rack::Sendfile
use Rack::Lock
use #
use Rack::Runtime
use Rack::MethodOverride
use ActionDispatch::RequestId
use Rails::Rack::Logger
use ActionDispatch::ShowExceptions
use ActionDispatch::DebugExceptions
use ActionDispatch::RemoteIp
use ActionDispatch::Callbacks
use ActiveRecord::ConnectionAdapters::ConnectionManagement
use ActiveRecord::QueryCache
use ActionDispatch::Cookies
use ActionDispatch::Session::CookieStore
use ActionDispatch::Flash
use ActionDispatch::ParamsParser
use Rack::Head
use Rack::ConditionalGet
use Rack::ETag
run Metricdemo::Application.routes
Note that the Librato::Rack middleware is the very first item in the list, while my Rails app is the last. The request timing numbers reported by the Librato Rack middleware (rack.request.time) will take into account the performance of all of the Rack middleware components while the Rails timing metric (rails.request.time) only starts measuring once the request reaches the Rails app. Ideally, these two numbers will be fairly close, but it’s worth monitoring to see if you have any misbehaving middleware in your stack.
If happen to be using a non-Rails, Rack-based framework you can still get the Rack metrics by using the librato-rack gem directly (for Rails users it’s included automatically as a dependency of librato-rails). Both the librato-rails and librato-rack gems are built on top of the librato-metrics gem which serves as a general-purpose Ruby wrapper for the Librato API.
Custom Measurements
Between the librato-rack and librato-rails there are more than 70 different performance metrics[PP1] that will be automatically reported. However, there are almost certainly other, application-specific measurements that you’d like to collect and submit to Librato. If you go back to the list of “what to measure” at the top of this article you may notice that there is one item that isn’t covered by the standard instrumentation: external service time.
Whereas Rails has good insight into the requests your app receives, the DB queries you make, and the templates you render, it typically knows nothing about external services you interact with. For this reason, there are no built-in ActiveSupport events for external service invocations. If you want to measure how much of your overall request time is spent, for example, interacting with the Twitter API, it’s up to you to do that instrumentation.
Luckily the librato–rails gem has you covered with a set of helper methods that make it incredibly easy to submit custom measurements to Librato.
Librato.timing 'twitter.service.time' do
  @twitter_user = Twitter.lookup(params[:user])
end
In this case, we’re using the Librato.timing helper to report a new metric named twitter.service.time which will measure the time it takes to look up a user with the Twitter API. With our new twitter.service.time metric, we can create a new chart that shows the breakdown of request time across database calls, Twitter service calls, and template rendering.
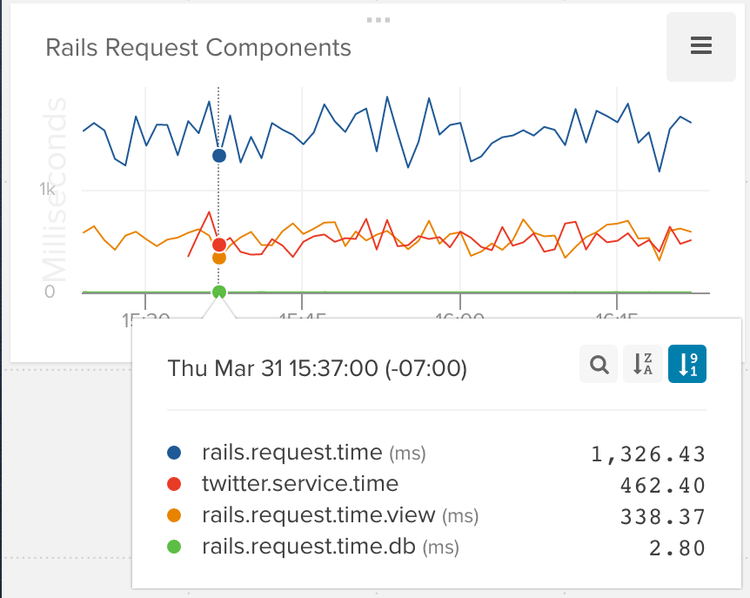
In addition to Librato.timing there are some other metric helpers available which are documented in the librato-rails readme.
If you are concerned about coupling your core application code to the Librato gem you can leverage the same Active Support Instrumentation API mentioned previously to instrument your code more generically. For example, you could create a custom event for your Twitter service call:
ActiveSupport::Notifications.instrument 'service_call.twitter' do
  @twitter_user = Twitter.lookup(params[:user])
end
Then subscribe to your event and pass the data along to Librato:
ActiveSupport::Notifications.subscribe 'service_call.twitter' do |*args|
  event = ActiveSupport::Notifications::Event.new(*args)
  Librato.measure 'twitter.service.time', event.duration
end
Now, instead of having calls to the Librato library littered throughout your code, you can limit them to just a few event subscribers. Note in the example above that we’re using the Librato.measure method instead of Librato.timing due to the fact that the notification event has already measured the elapsed time of the service call for us—we simply need to pass the measured value along to Librato in this case.
Instrument, Monitor, Tweak, Repeat
There are a lot of other components in your application stack that should be monitored (OS, HTTP server, , background jobs, deploys, etc…), but your application code may be the most important because it’s the one where you can have the greatest impact. If you see DB times spiking in production, it’s probably a sign that you need to optimize your queries. If you see template rendering time increasing, it may be time to look at some caching strategies. It’s hard to know that you have these problems (or prove that you’ve fixed them) unless you have the data to support it.
Rails makes it pretty easy to get all sorts of useful stats out of your application and the Librato Rails integration makes it downright trivial. The hardest part is probably figuring out what other parts of your application you want to monitor, but we’ve tried hard to make it as painless as possible to get your metrics into Librato and then give you the tools you need both to visualize your data and to be alerted when values exceed their expected range.
