Azure App Service makes it easy to host reliable and scalable web applications. However, this doesn’t mean you can ignore your applications after deployment. Errors, performance issues, and other problems can occur at any time, affecting your quality of service and revenue. Staying on top of problems like these requires comprehensive monitoring, and application performance monitoring (APM) solutions like SolarWinds® AppOptics™ can help.
In this post, we’ll explain why monitoring App Service is crucial, and the role it plays in optimizing performance and availability.
Why Monitoring Azure App Service Is Critical
Application monitoring is important for measuring the speed, reliability, and capacity of your applications. It can also notify you of potential problems—such as saturated resources or crashes—via automated alerts. This helps you to identify bottlenecks and crash-prone areas of your applications. Addressing these issues can lead to better performance, greater stability, and more efficient use of platform resources.
App Service is a fully managed PaaS that makes it easy to deploy and scale web applications. However, while the infrastructure may be fully managed, you’re still responsible for making sure your applications are performant and stable. To help with this, App Service provides both application and infrastructure metrics for each application including response time, CPU and RAM usage, disk I/O, bandwidth, HTTP status, and garbage collection runs.
This allows you to answer questions such as:
- How many connections and threads are currently open?
- How close is your resource consumption to your quota or App Service plan capacity?
- How does request throughput and request volume impact resource usage?
- How often do maintenance tasks run, such as garbage collection? (This could indicate poor resource management.)
How AppOptics Helps
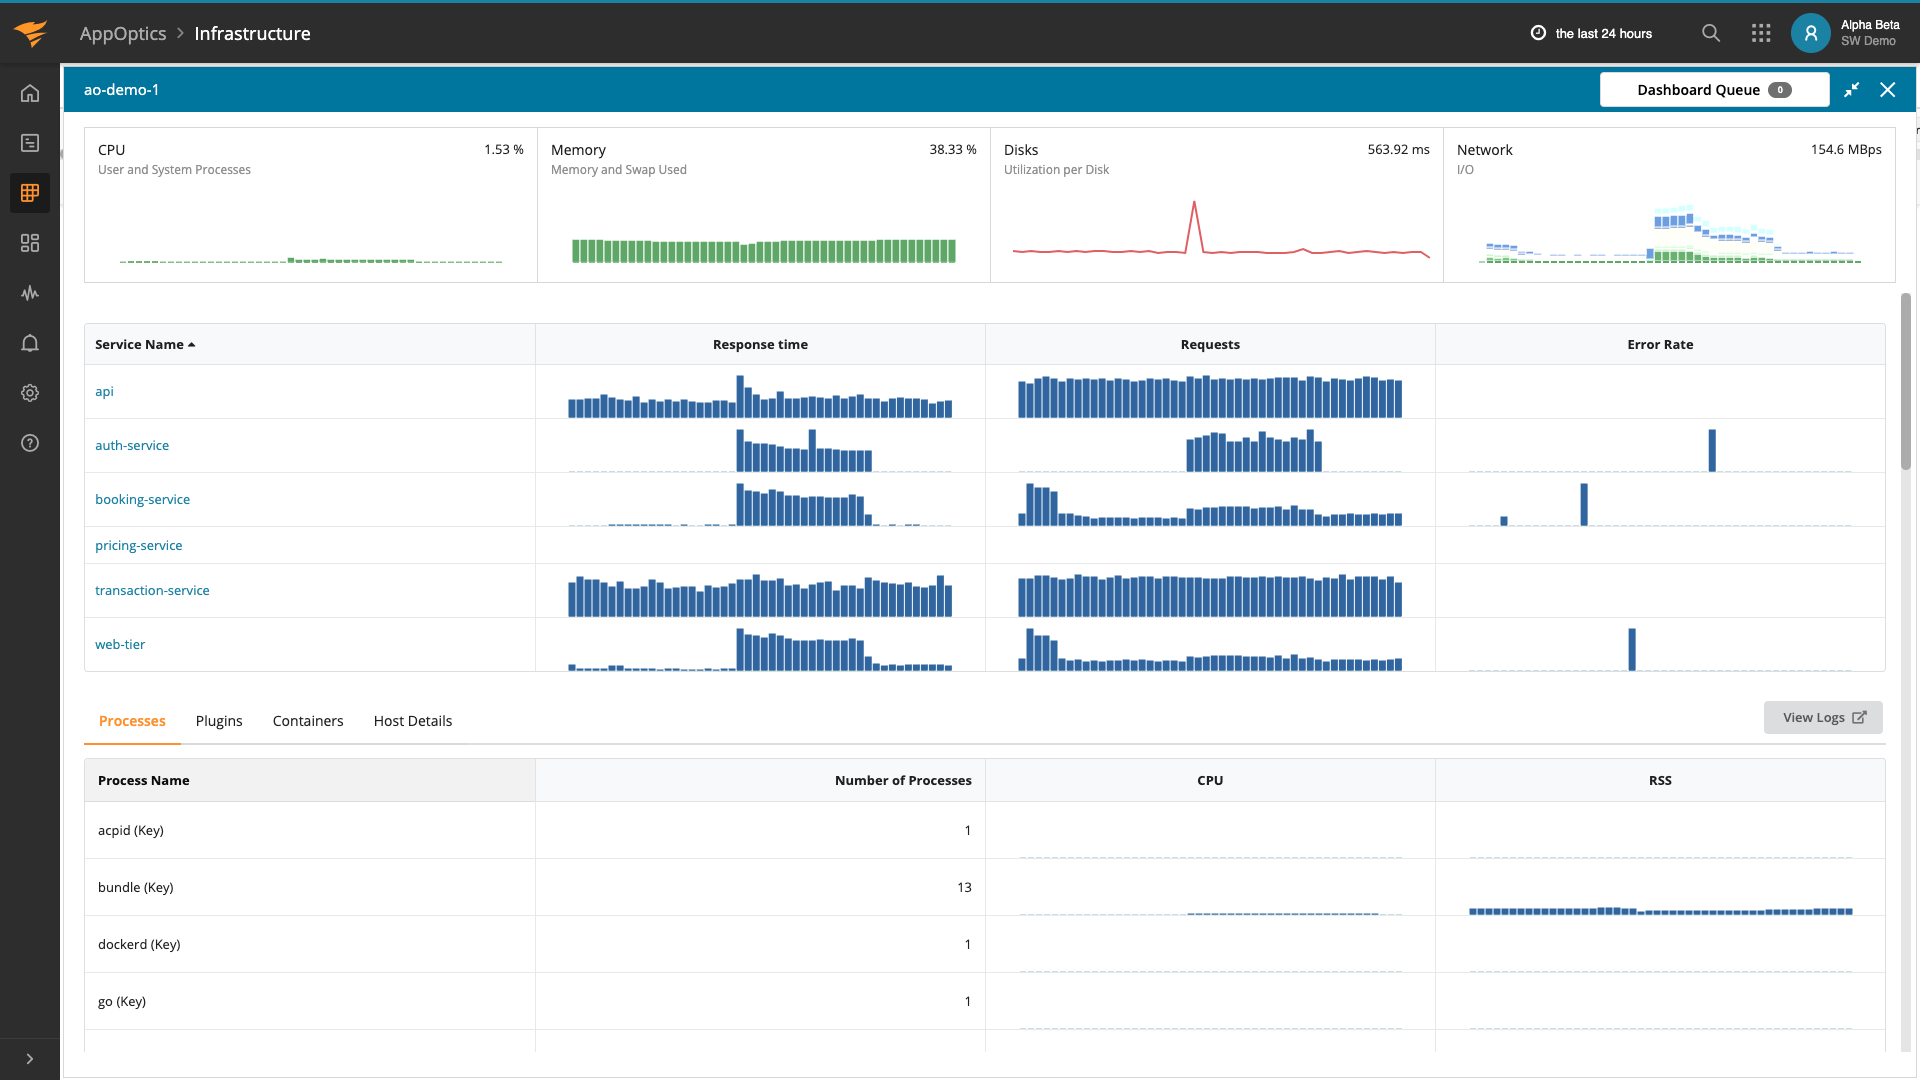
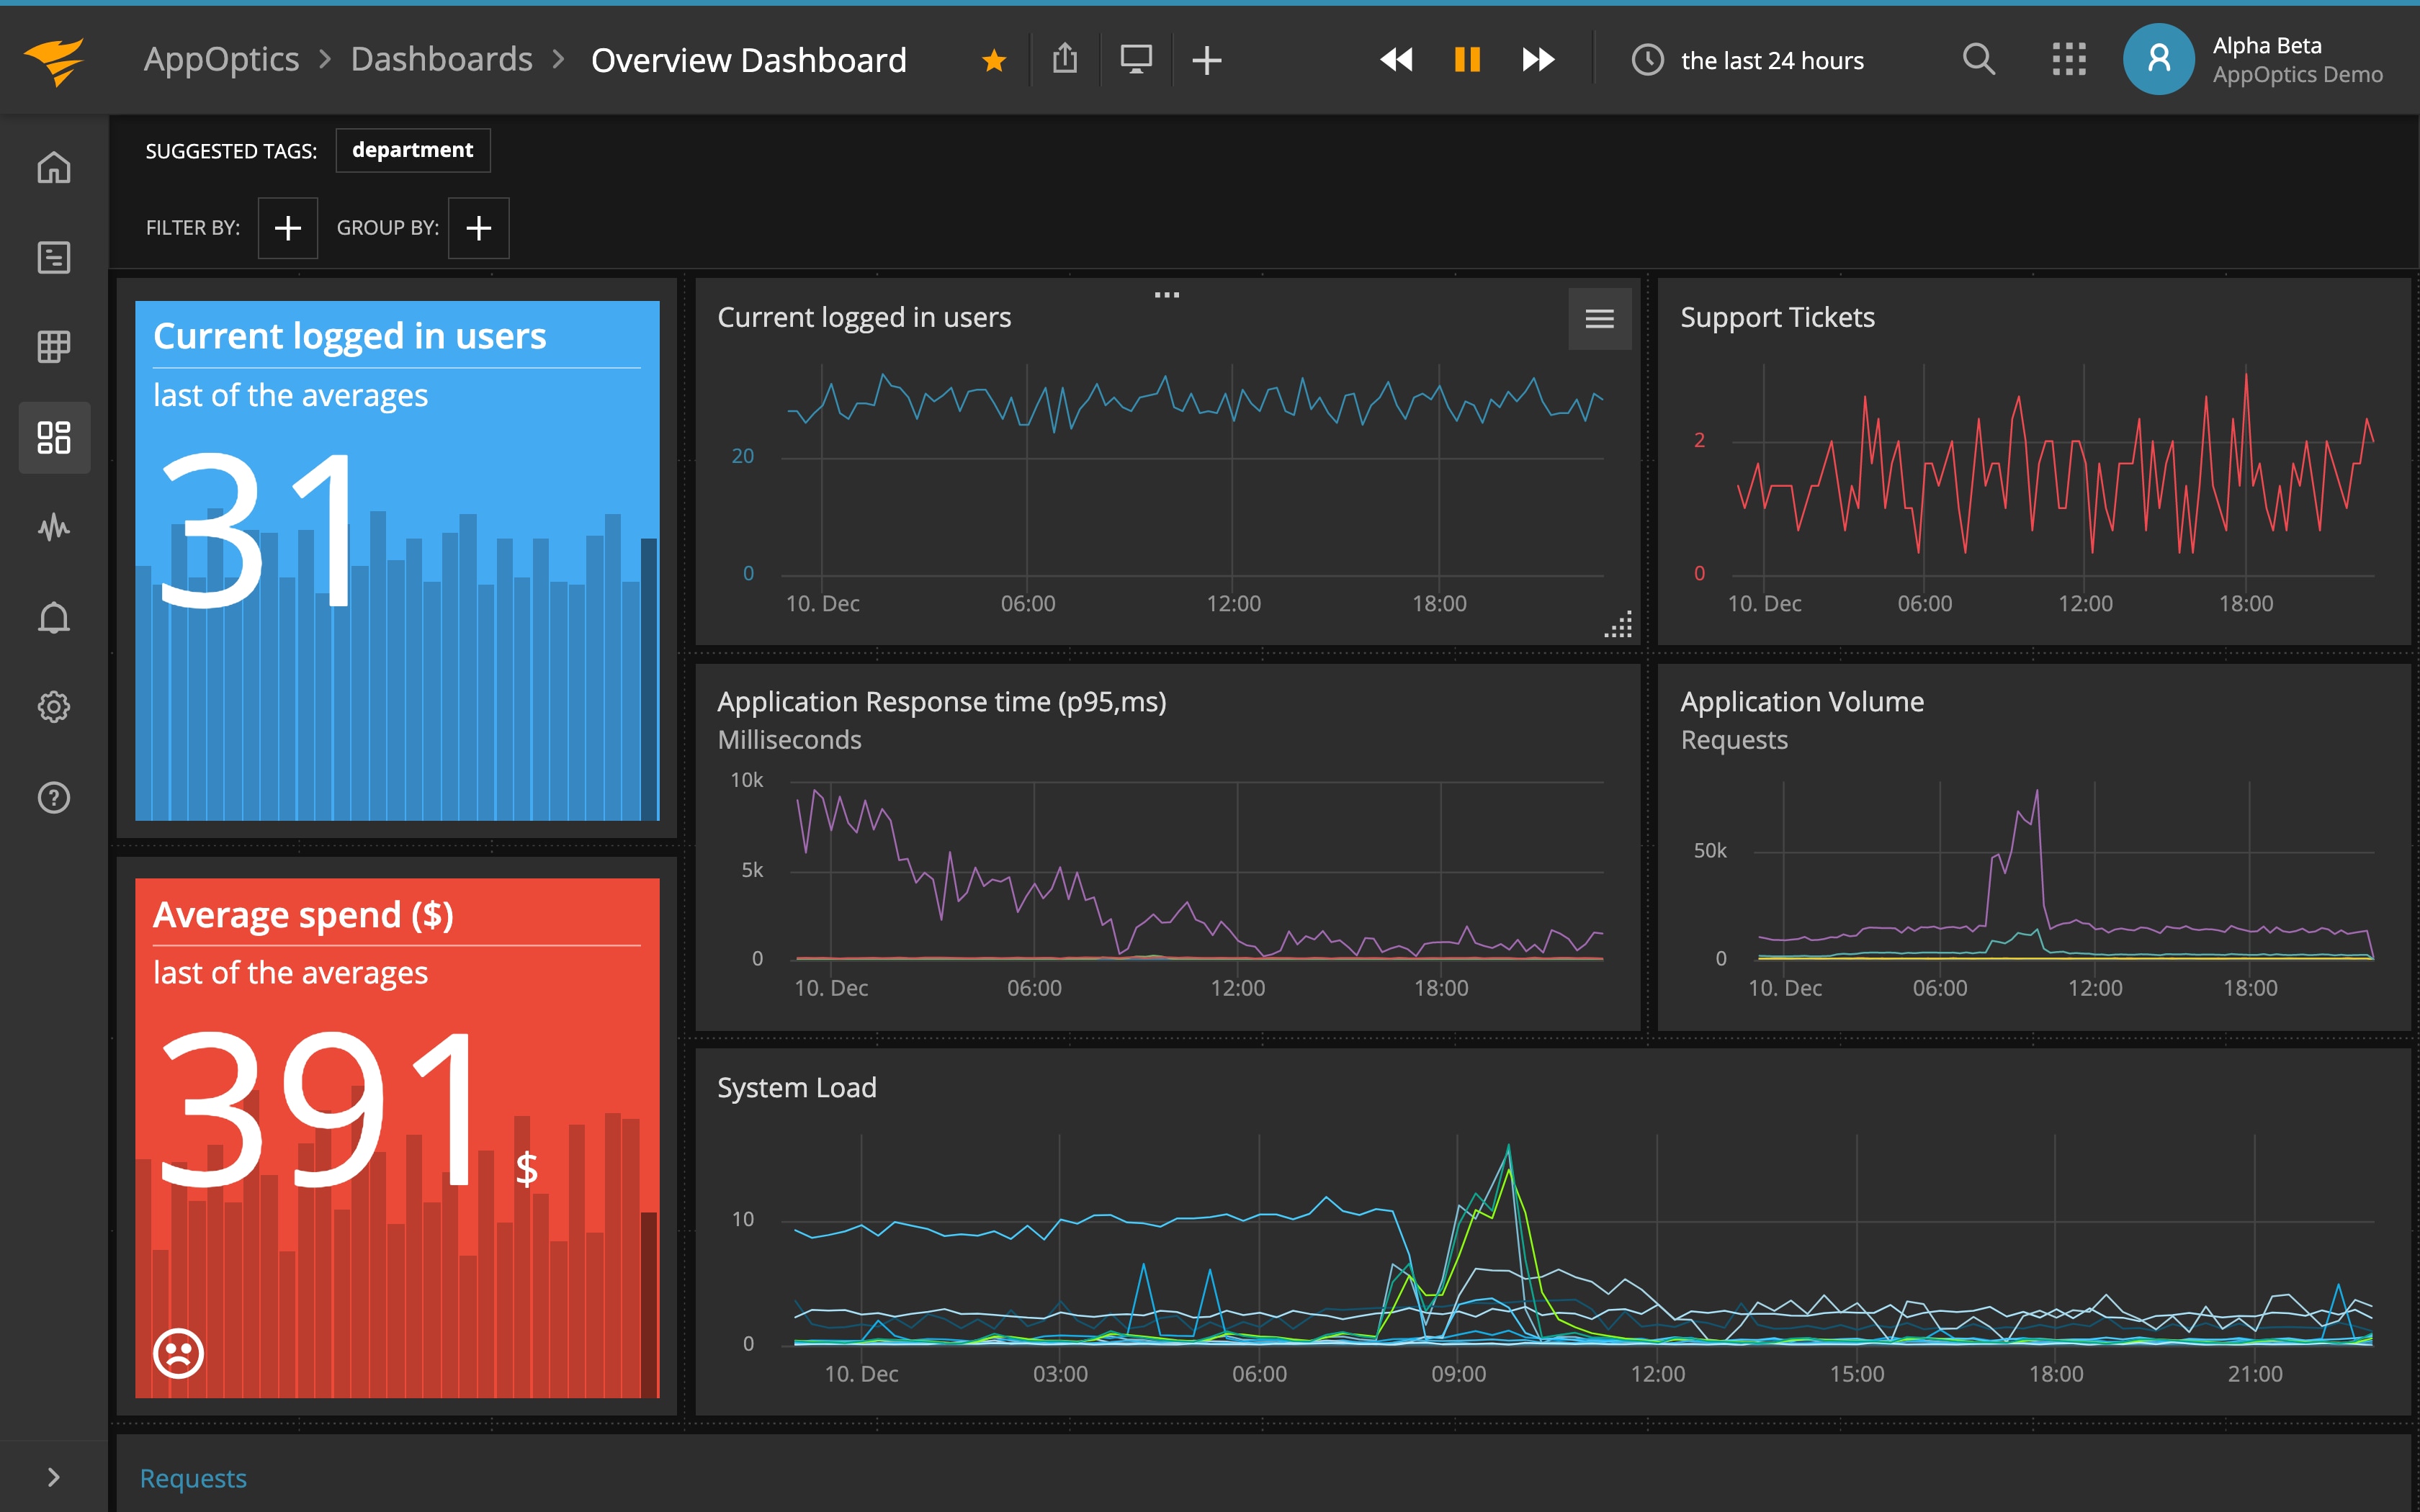
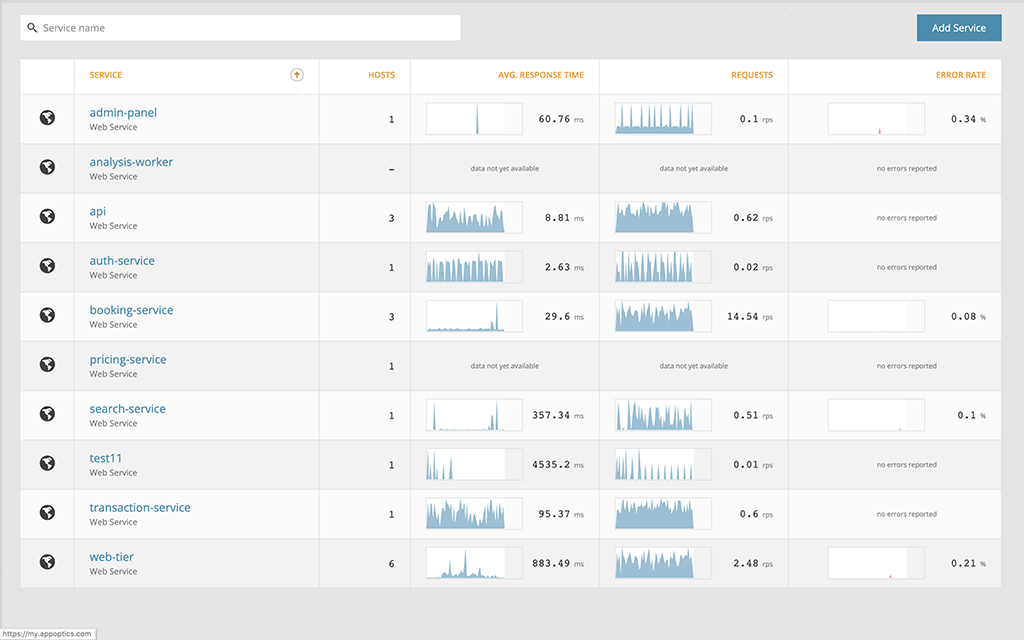
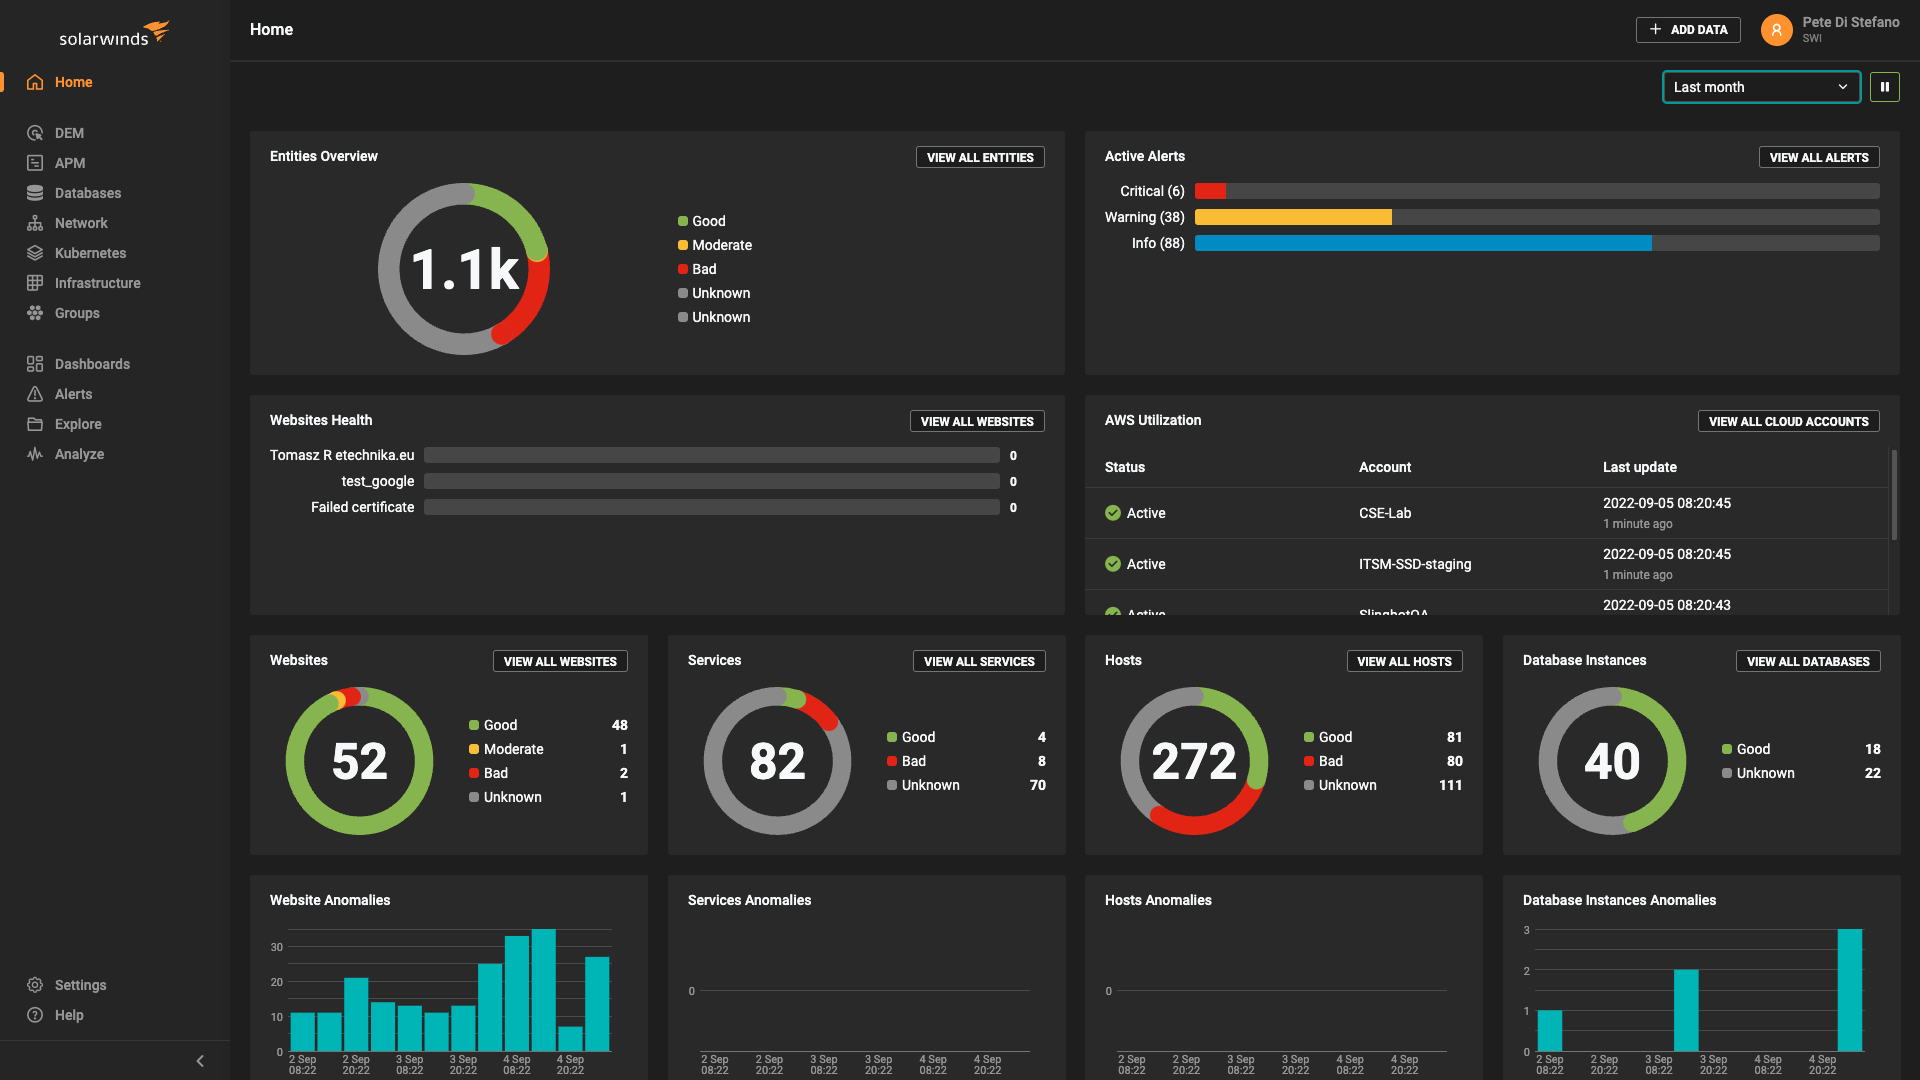
AppOptics provides an APM solution for App Service with consolidated metrics collection, preconfigured dashboards, distributed tracing, code profiling, and many more features. AppOptics can correlate a single event spanning multiple Azure services, as well as multi-cloud applications.
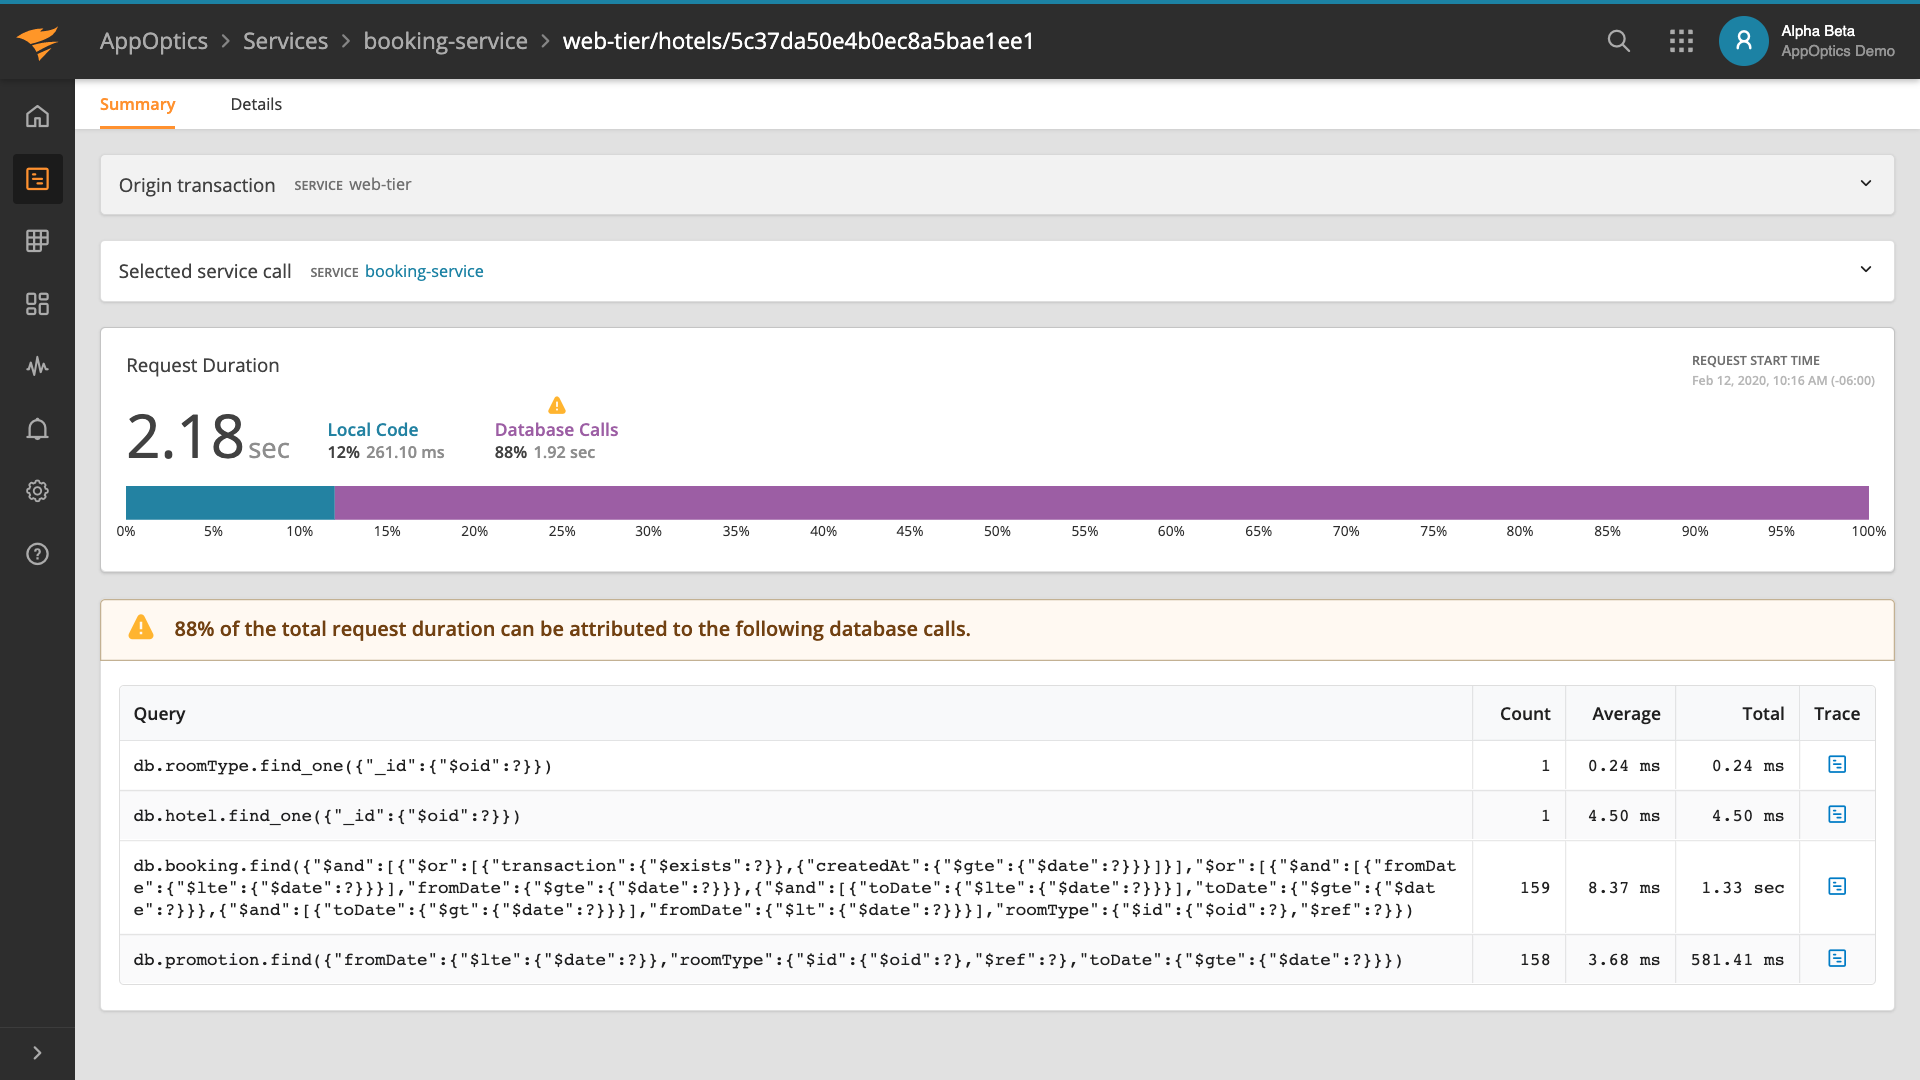
If your application is underperforming, AppOptics will show you which layers of your application are causing the greatest amounts of latency and errors, and how they affect the rest of your application. This gives you a holistic view of your applications, services, and infrastructure, all from a single pane of glass.
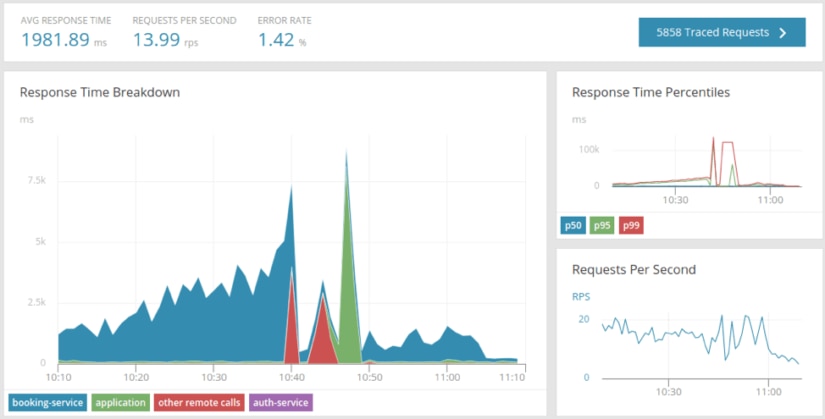
In addition to App Service, AppOptics integrates with Azure Monitor allowing you to monitor Cosmos DB, Functions, SQL Database, Virtual Machines, and a number of other Azure services. This provides you with a holistic view of your Azure workloads with real-time monitoring, service-specific metrics, and a powerful alerting solution, allowing you to quickly detect and resolve problems. For example, if your application leverages Azure Cache for Redis, you can view Redis metrics and dashboards to determine your cache hit ratio, cache latency, and other performance indicators.

How to Monitor App Service Effectively
Once your App Service metrics are in AppOptics, consider:
- Monitoring the most relevant metrics including key performance indicators (KPIs) that directly impact service quality, such as request rate, error rate, and request duration.
- Analyzing changes in KPIs due to events such as new deployments, traffic spikes or dips, and changes to your App Service plan.
- Setting alerts for downtime, errors, and anomalies based on your KPIs. AppOptics provides a flexible alerting system that can notify you of problems early.
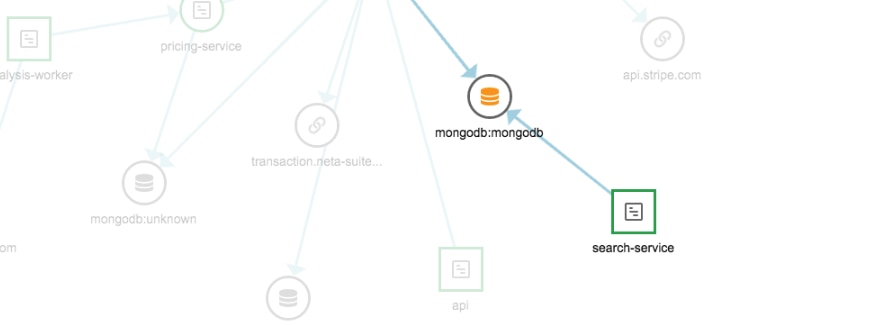
- Tracing the flow of requests through your applications and infrastructure, including workloads hosted on other cloud platforms.
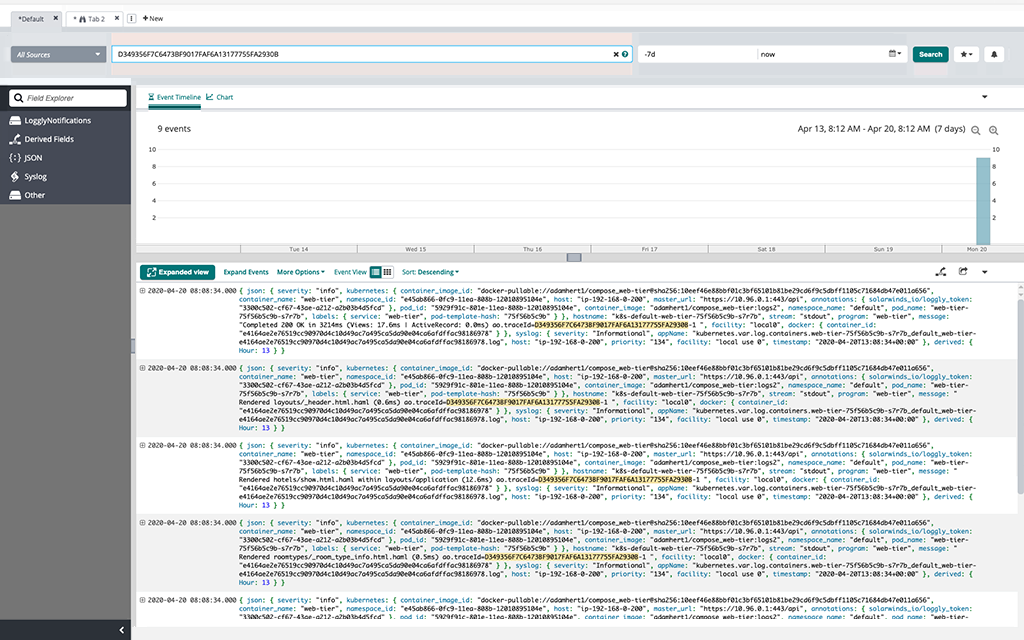
For a more detailed view of specific events, AppOptics integrates with SolarWinds Loggly®, a high-volume log aggregation, analytics, and visualization tool. AppOptics automatically connects transaction traces to the log events associated with the services making up a transaction. With one click you can combined detailed transaction tracing with logs for detailed troubleshooting and debugging data that can’t be provided via metrics. This makes it easier to access comprehensive diagnostic data and perform root cause analyses.
Conclusion
The key to performance is visibility: the better you understand how your application behaves, the easier it is to optimize. AppOptics and Loggly provide a full-stack view of your Azure applications and infrastructure, so you can measure, track, and address performance issues more easily. To learn more, visit AppOptics Azure monitoring. You can also get started with a free AppOptics 30-day trial.
