Monitoring of distributed systems calls for powerful tooling capable of dealing with ephemeral infrastructure. Contemporary cluster architectures like those using Kubernetes, where loosely coupled containers come and go as they are scheduled and nodes evacuated, require a cloud-native approach to effective monitoring. And while it’s impossible to predict the myriad states of partial failure various parts of your distributed applications might end up in, SolarWinds AppOptics has taken the first steps in simplifying your monitoring of these complex systems.
As an active member of the Cloud Native Computing Foundation (a Cloud Native Ambassador and Technical Oversight Committee Contributor), I’ve been keen on our support of customers leveraging these projects (we use and contribute to many of them in the delivery of our services). While Kubernetes is the flagship project within the CNCF, there are many other strong contenders for the spotlight. AppOptics has integrations with Prometheus, Fluentd (via Papertrail), Opentracing and Istio (yet to be adopted as a CNCF project). Kubernetes is the first to reached a Graduated project level, which means going mass market.
From first launch late last year, AppOptics offered support monitoring Kubernetes – both its control plane components and containerized applications running within its clusters. Today, Amazon Web Services is launching the Elastic Kubernetes Service – a managed Kubernetes offering – joining the ranks of other public cloud service offerings that host and manage the world’s most popular container orchestrator.
EKS in a Nutshell
With no masters to manage in EKS, you forego the need for cluster deployment tools like that of the recommended kops. Guaranteed to be upstream compatible, Amazon EKS is Certified Kubernetes Conformant, which means that applications running on EKS are fully compatible with applications running on any standard Kubernetes environment. In addition to vanilla Kubernetes, EKS includes a number of integration points with other AWS services. Those integrations are made possible either by other open source projects in the Kubernetes ecosystem or projects that Amazon has open sourced. EKS includes these projects:
- A Container Network Interface plugin for Kubernetes pod networking using Elastic Network Interfaces on AWS. SolarWinds has been supportive stewards of CNI in its adoption as the tenth hosted project in the CNCF and consider this plugin a key integration to AWS VPCs and the rest of EC2’s networking.
- Heptio Authenticator as a tool for using AWS IAM credentials to authenticate to a Kubernetes cluster, facilitating creation of a dedicated KubernetesAdmin role at cluster provisioning
- An Application Load-Balancer Ingress Controller that satisfies Kubernetes ingress resources by provisioning Application Load Balancers that route traffic into your clusters.
Monitoring EKS with AppOptics
As an AppOptics user, you have choice of two modes of deployment (or both), depending on whether you’re looking to monitor Kubernetes cluster health or monitor application health within containers orchestrated by EKS.
- Deployment – A single pod to talk to the Amazon EKS API to send Kubernetes cluster health metrics to AppOptics.
- DaemonSet – A DaemonSet that runs a pod on every node in your cluster and publishes both node and application-specific metrics to AppOptics.
The Kubernetes plugin for AppOptics comes with prefabricated dashboards written with embedded domain knowledge of EKS and metrics used as key indicators of Kubernetes’ cluster health.
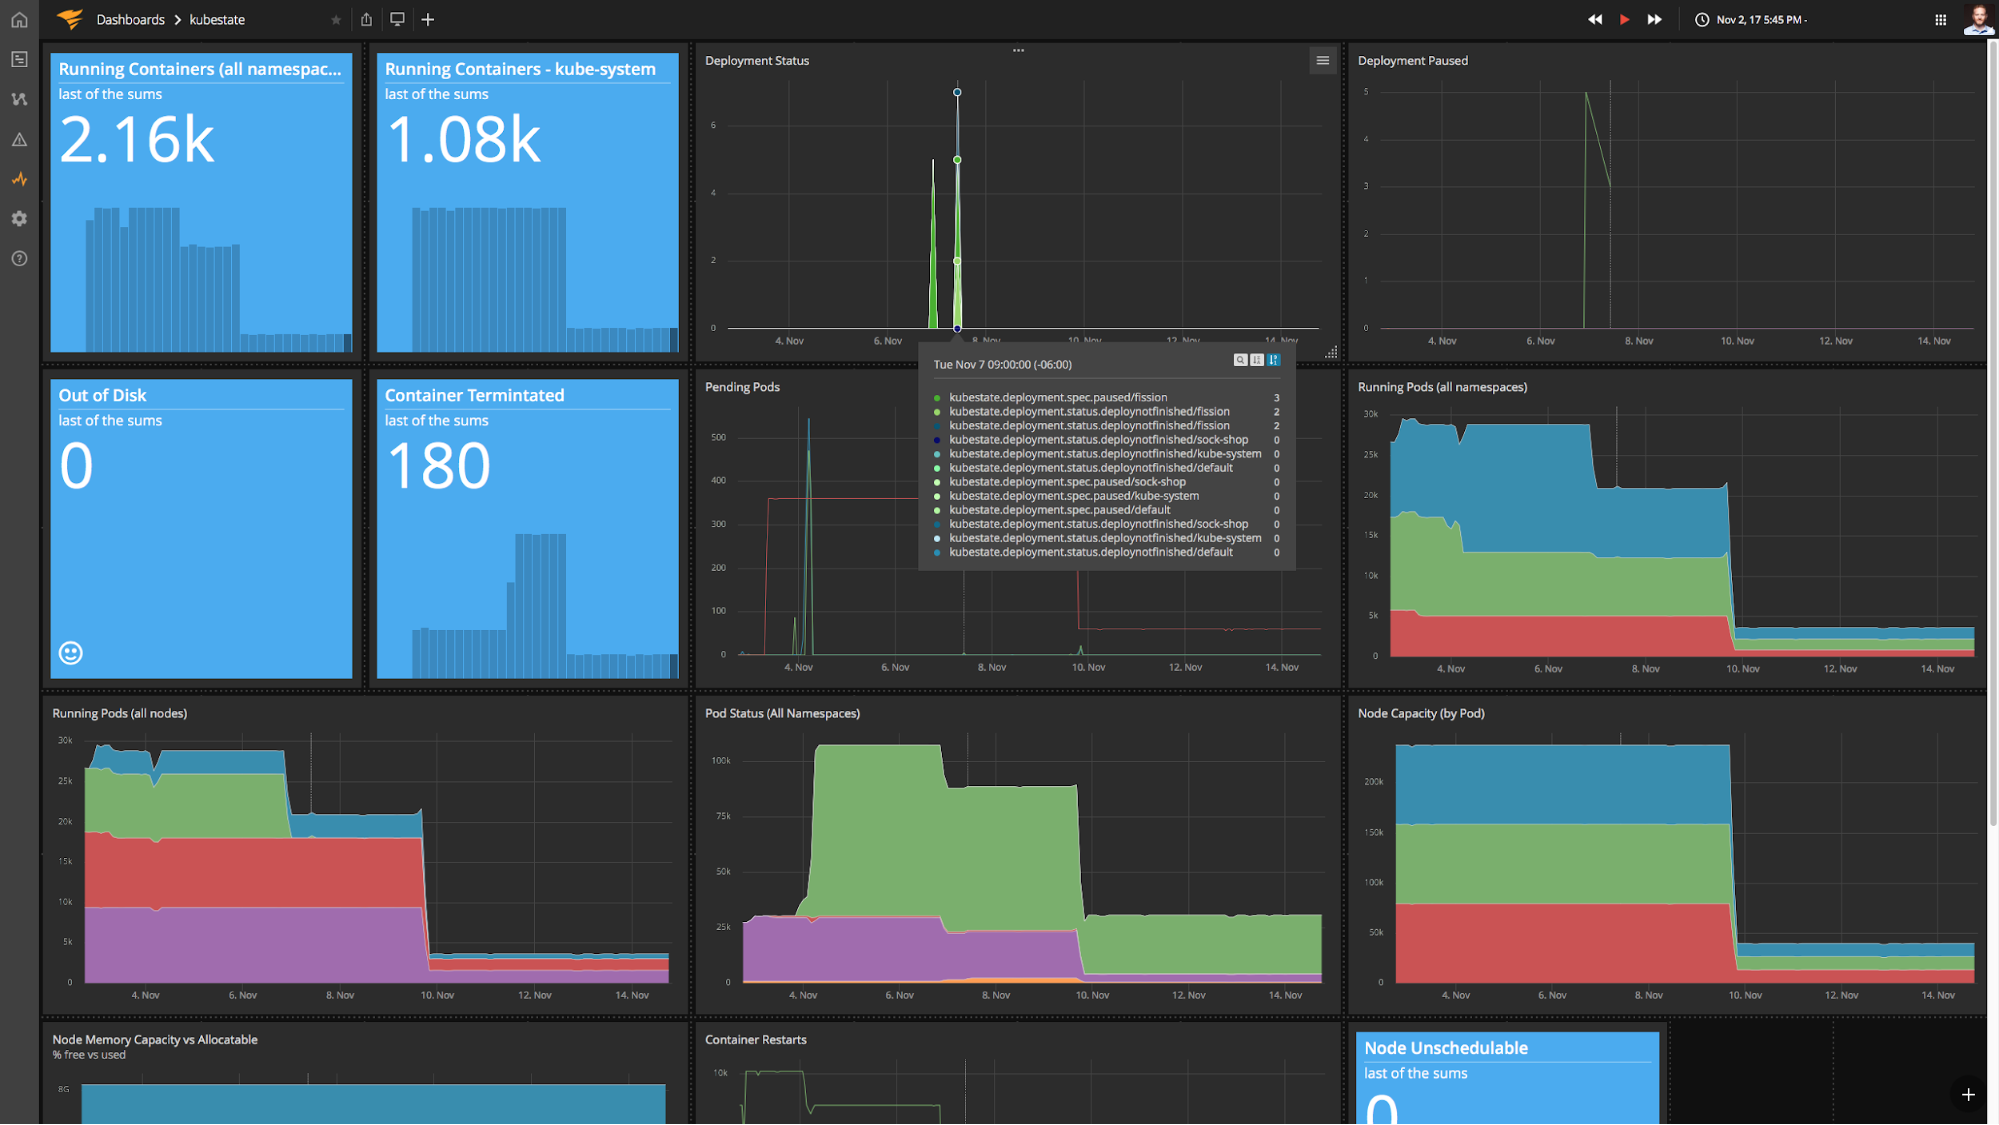
There are many indicators of Kubernetes cluster health built into the out of the box dashboard. Below are two example metrics used at key indicators of EKS cluster health – Pending Pods and Stable Deployments.
Pending Pods
Pods in the Pending state have been accepted by the Kubernetes system, but one or more of the containers has not been created. This includes time before being scheduled as well as time spent downloading images over the network, which could take a while.
If your pending pods metric sees a sudden surge, this means that the pod could not be scheduled on a node. Typically, this is because of insufficient CPU or memory resources. The number of Pending Pods could also rise due to the absence of a network overlay or a volume provider. Our best practices suggest that no pods are stuck in the Pending state and that every pod transitions to Running on a worker node within 5 minutes, otherwise generate an alert.

Stable Deployments
Your Deployment may get stuck trying to deploy its newest ReplicaSet without ever completing. Unless you’re in the middle of a rolling update, you should make sure the number of available Replicas within a Deployment always matches the desired number of replicas. Deployment failures can occur due to:
- Insufficient quota
- Readiness probe failures
- Image pull errors
- Insufficient permissions
- Limit ranges
- Application runtime misconfiguration
During a rolling update, you should expect Deployments to transition phases. However, as an overarching indicator of Deployment health, once a Deployment is complete, the number of desired Replicas should equal the number of available Replicas.

Be sure to read about the rest of the Kubernetes metrics we collect and why their monitoring is important to maintaining a healthy EKS deployment.
In partnership with Amazon, SolarWinds is proud to support the launch of EKS! Existing AppOptics users have immediate access to these partner-integrated capabilities. New users may sign up for a free trial anytime!