


Redis is an open source. in-memory data structure store with blazing performance that’s used as a database, cache, and message broker. Redis is licensed under BSD (Berkeley Source Distribution), which means it can be used for free with some minimum use restrictions. It supports a good number of abstract data structures, such as strings, maps, lists, and so on.
Redis, which is used as a database to store data, is fast in performance. According to the Redis homepage:
“In order to achieve its outstanding performance, Redis works with an in-memory dataset. Depending on your use case, you can persist it either by dumping the dataset to disk every once in a while, or by appending each command to a log.”

Some Important Metrics to Monitor in Redis
When you’re working with Redis, there are several metrics you can monitor. And like anything else, not all the metrics are important. However, if you have enough time, it can be a good idea to simply monitor every single metric. In this post, I’ve chosen some of the most important metrics to monitor.

Error Metrics
Error metrics are used to measure the performance and get alerts about some commonly crucial errors. These include rejected connections, keyspace misses, and how many seconds the primary link has been down.
Metrics alert on the rejected connections. Redis can handle many connections, and by default, Redis has a maximum number of client connections set at 10,000 connections. You can set the maximum number of client connections you want the Redis server to accept by altering the maxclient from within the redis.conf file. When you’ve set the maximum number of connections and a client tries to connect after this point, it’ll be disconnected.
Here’s something you might want to know, from the Redis documentation about clients. “Redis checks with the kernel what is the maximum number of file descriptors that we are able to open (the soft limit is checked). If the limit is smaller than the maximum number of clients we want to handle, plus 32 (that is the number of file descriptors Redis reserves for internal uses), then the number of maximum clients is modified by Redis to match the amount of clients we are really able to handle under the current operating system limit.”
Metrics alert on keyspace_misses, or the number of failed lookups of keys in the main dictionary. When Redis does research using keywords, there are only two possible outcomes—either the keyword exists or it doesn’t. When you’re not using Redis as a cache, you should set the keyspace_misses to zero or near zero.
The other important error metric is master_link_down_since_seconds. This is the number of seconds since the link has been down. In other words, it’s the number of seconds from the time a replica is disconnected from the primary. This metric is available only when the link is down.
Performance Metrics
Monitoring the server’s resources is important and not something you can overlook. For example, monitoring the CPU, storage, and network is always a great idea. You can avoid this only if your Redis provider takes care of everything for you.
Depending on what you’re using Redis for, you might need to scale the resource to improve the latency. Latency is the period an operation takes to complete a request. So if your latency isn’t breaking when you have more traffic hitting your Redis server, then your Redis performance is doing fine and you don’t need to scale it, although you can always improve it for much better performance.
Persistence Metrics
If you’re using Redis not only for caching reasons, but also want to save data in the Redis database, enabling data persistence becomes necessary. A replica copies whatever is in the primary; now when the primary restarts, data is lost. Since a replica copies the primary, that means the replica will copy empty data from the primary. You can watch these two metrics to monitor persistence metrics in Redis: rdb_last_save_time and rdb_changes_since_last_save. Rdb_last_save_time is the Unix timestamp that returns the last successful time data was saved in the disk. By contrast, rdb_changes_since_last_save is the number of changes to the database since the last dump.
Memory Metrics
If you want to know how much memory Redis has used, you can look into the Redis memory metrics by watching the used_memory. This shows the amount of memory in bites that Redis has used. Memory usage is important for Redis’ performance. When used_memory exceeds the total available system memory, the operating system begins swapping unused sections of system memory. This affects the performance of Redis, as every swapped section is written to disk. You can avoid this by setting the maxmemory directive in the redis.conf file. Doing this will give you the control you need about Redis memory usage. For maxmemory to work, you’ll have to configure an eviction policy for Redis to determine how it should free up memory. Another metrics alert to watch is mem_fragmentation_ratio. Even though it doesn’t affect performance, it can cause an increase in memory usage.
Basic Activity Metrics in Redis
Basic activity metrics help you improve the foundational elements of your Redis database. This gives good performance to Redis memory and persistence operations. Some of the metrics to watch in basic activity metrics are connected_clients, connected_slaves, master_last_io_seconds_ago, and keyspace.
Connected_clients is the number of clients connected to the Redis. If the number of connected clients is high, it can cause a problem. That is, the Redis server might fail to process all the requests from clients.
Connected_slaves is the number of replicas connected to the current primary instance. If you’re using primary-replica database replication features available in Redis, it can be important to monitor the connected_slaves.
Master_last_io_seconds_ago is the time in seconds since the last interaction between replica and primary. Keyspace is the total number of keys in your database. It’s a smart idea to keep track of the number of keys in the database. If the keyspace increases in volume, Redis will require more physical memory to ensure the performance isn’t compromised.
Client Connections Statistics
Redis always accepts clients’ connections on the TCP port configured to listen to any connection and on the Unix socket, if it’s enabled. In the Redis config file (redis.conf), there’s maxclients, a property describing the maximum number of clients that can connect to Redis server.
This example demonstrates how you can set the maximum number of clients to connect to Redis:
config get maxclients
1) “maxclients”
2) “10000”
You can also set the maximum number of clients you want to connect to Redis by passing two options like this: redis-server—maxclients 100000.
Keyspace Statistics
The keyspace in Redis provides statistics on the main dictionary and the database. The statistics are the number of keys, and the number of keys with an expiration.
Redis Monitoring Tools
Redis is a NoSQL database well-known for its fast speed, performance, and flexible data structures. Because of this, it’s easy to insert data in Redis, be it list or dictionaries.
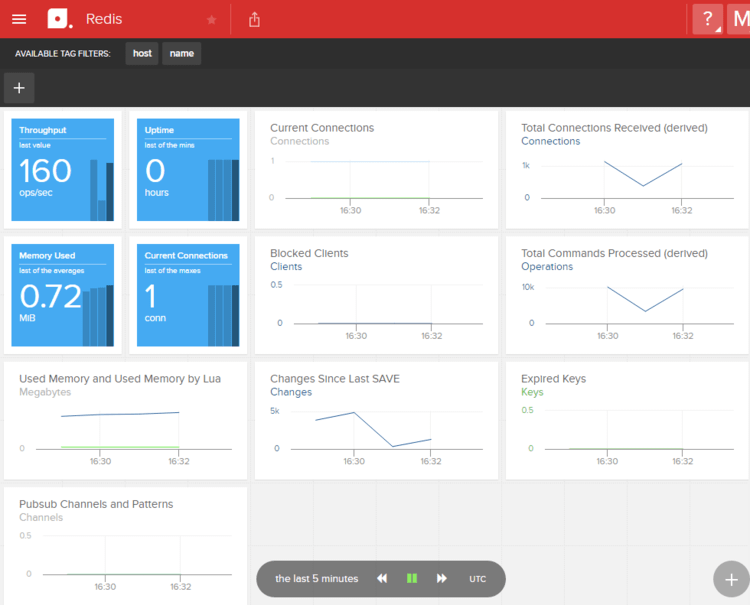
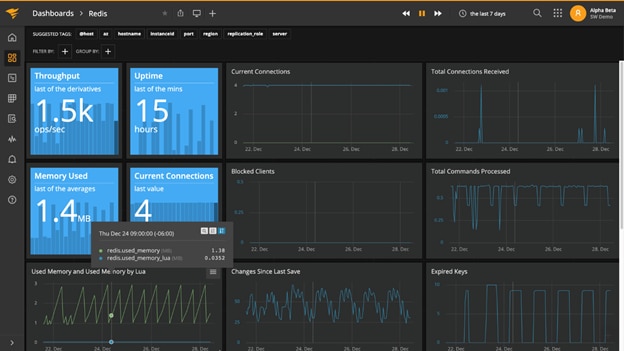
Monitoring Redis isn’t all that straightforward. It needs a good platform where you can visualize the data in a nice way, and platforms like SolarWinds® AppOptics™ can help. Being open source software, Redis has several open source tools you can use to monitor its performance and other elements, such as memory.
Redis-cli
Redis comes with a CLI (command line) tool you can use to send commands to the Redis server. You can also read the reply from the server within the Redis CLI tool. Redis CLI is a helpful tool and simple to use when you’re monitoring the server. Connecting to the Redis server can be as simple as this:
$ redis-cli -u redis://<password>@redis-16379.hosted.com:16379/0 ping
PONG
Reddish
Reddish is a self-hosted tool with an interface, making it easy to monitor Redis. It’s free and open source software, which means you can add new features to meet your needs.
Redmon
Redmon is a simple web-based dashboard for Redis. You can use this simple and open source tool to monitor your Redis server. It has a nice-looking UI and also comes with a command line interface, should you prefer CLI over GUI. Redmon also lets you watch your Redis server live because it has a configurable pooling seconds option.
Redis-stat
Redis-stat is free and open source—a simple Redis monitoring tool written in Ruby. Although it’s no longer maintained, you can still use the software. And because it’s open source, you can develop features you might need or fix the bugs that can arise. The tool is based on the Redis info commands.
RedisLive
And finally, RedisLive helps you visualize your Redis instances and analyze query patterns and spikes from the dashboard. It’s easy to use and has simple configuration.
You need only update the value of the key RedisServers to the Redis instances you intend to monitor. RedisLive also gives you an option to monitor multiple instances by appending more values to the RedisServers list.
Conclusion
Redis is powerful software you can use as a cache or database to store persistent data. It’s known for its speed and good performance, and it’s also an open source software. You can use it for free, unless you are using a redistributed one. Although you can use some apps to monitor your Redis server, most of these are open source. Consequently, the developers no longer maintain them. Using a command line interface doesn’t give a better view when you’re monitoring the server. Using a platform like AppOptics lets you monitor your server, while also monitoring all your apps in one place. You can visit their website to read about some of the services they offer in line with server monitoring.
This post was written by Mathews Musukuma. Mathews is a software engineer with experience in web and application development. Some of his skills include Python/Django, JavaScript, and Ionic Framework. Over time, Mathews has also developed interest in technical content writing.


