A comprehensive set of turnkey infrastructure integrations

Including dozens of AWS and Azure services, web, database, network, containers, orchestrations like Docker and Kubernetes, and more.

START FREE TRIAL

Complete visibility into the health and performance of applications and their underlying infrastructure

Quickly pinpoint the root cause of performance issues across the stack, down to a poor-performing line of code

START FREE TRIAL

Custom metrics and analytics

Analyze custom infrastructure, application, and business metrics

View Custom Metrics Monitoring Info
Powerful API that makes it easy to collect and create any custom metric

Achieve ultimate visibility and enhanced troubleshooting with synthetic and real user monitoring

START FREE TRIAL

Free APM Software

Catch bugs early on, and gain full visibility and insights into the applications you’re developing

View Product Info
Free, full-function APM tool for testing and troubleshooting application performance before moving into production

Dev Edition includes five traces per minute, 100 metrics, three hosts, and six containers

GET FREE TOOL

Log Management and Analytics powered by SolarWinds Loggly

Integrated, cost-effective, hosted, and scalable full-stack, multi-source log management

View Log Management and Analytics Info
Collect, search, and analyze log data in addition to your metrics and traces to quickly pinpoint application performance problems

Reduce mean time to resolution (MTTR) by quickly jumping from a trace or host view into the relevant logs to accelerate troubleshooting

START FRE TRAIL

Digital Experience Monitoring Powered by SolarWinds Pingdom

Make your websites faster and more reliable with easy-to-use web performance and digital experience monitoring

View Digital Experience Monitoring Info
Add client-side web application performance monitoring. Provide maximum observability by adding the user’s perspective.

Achieve ultimate visibility and enhanced troubleshooting with synthetic and real user monitoring

START FREE TRIAL

We’re excited to announce the general availability of a feature that many of our Librato customers have long been requesting. For Librato customers that have kicked the tires on our new AppOptics product, we appreciate your patience and hope you enjoy this long-awaited feature. Internally, this feature has been referred to as Dark Theme, but there’s more to it than just a simple theme toggle.

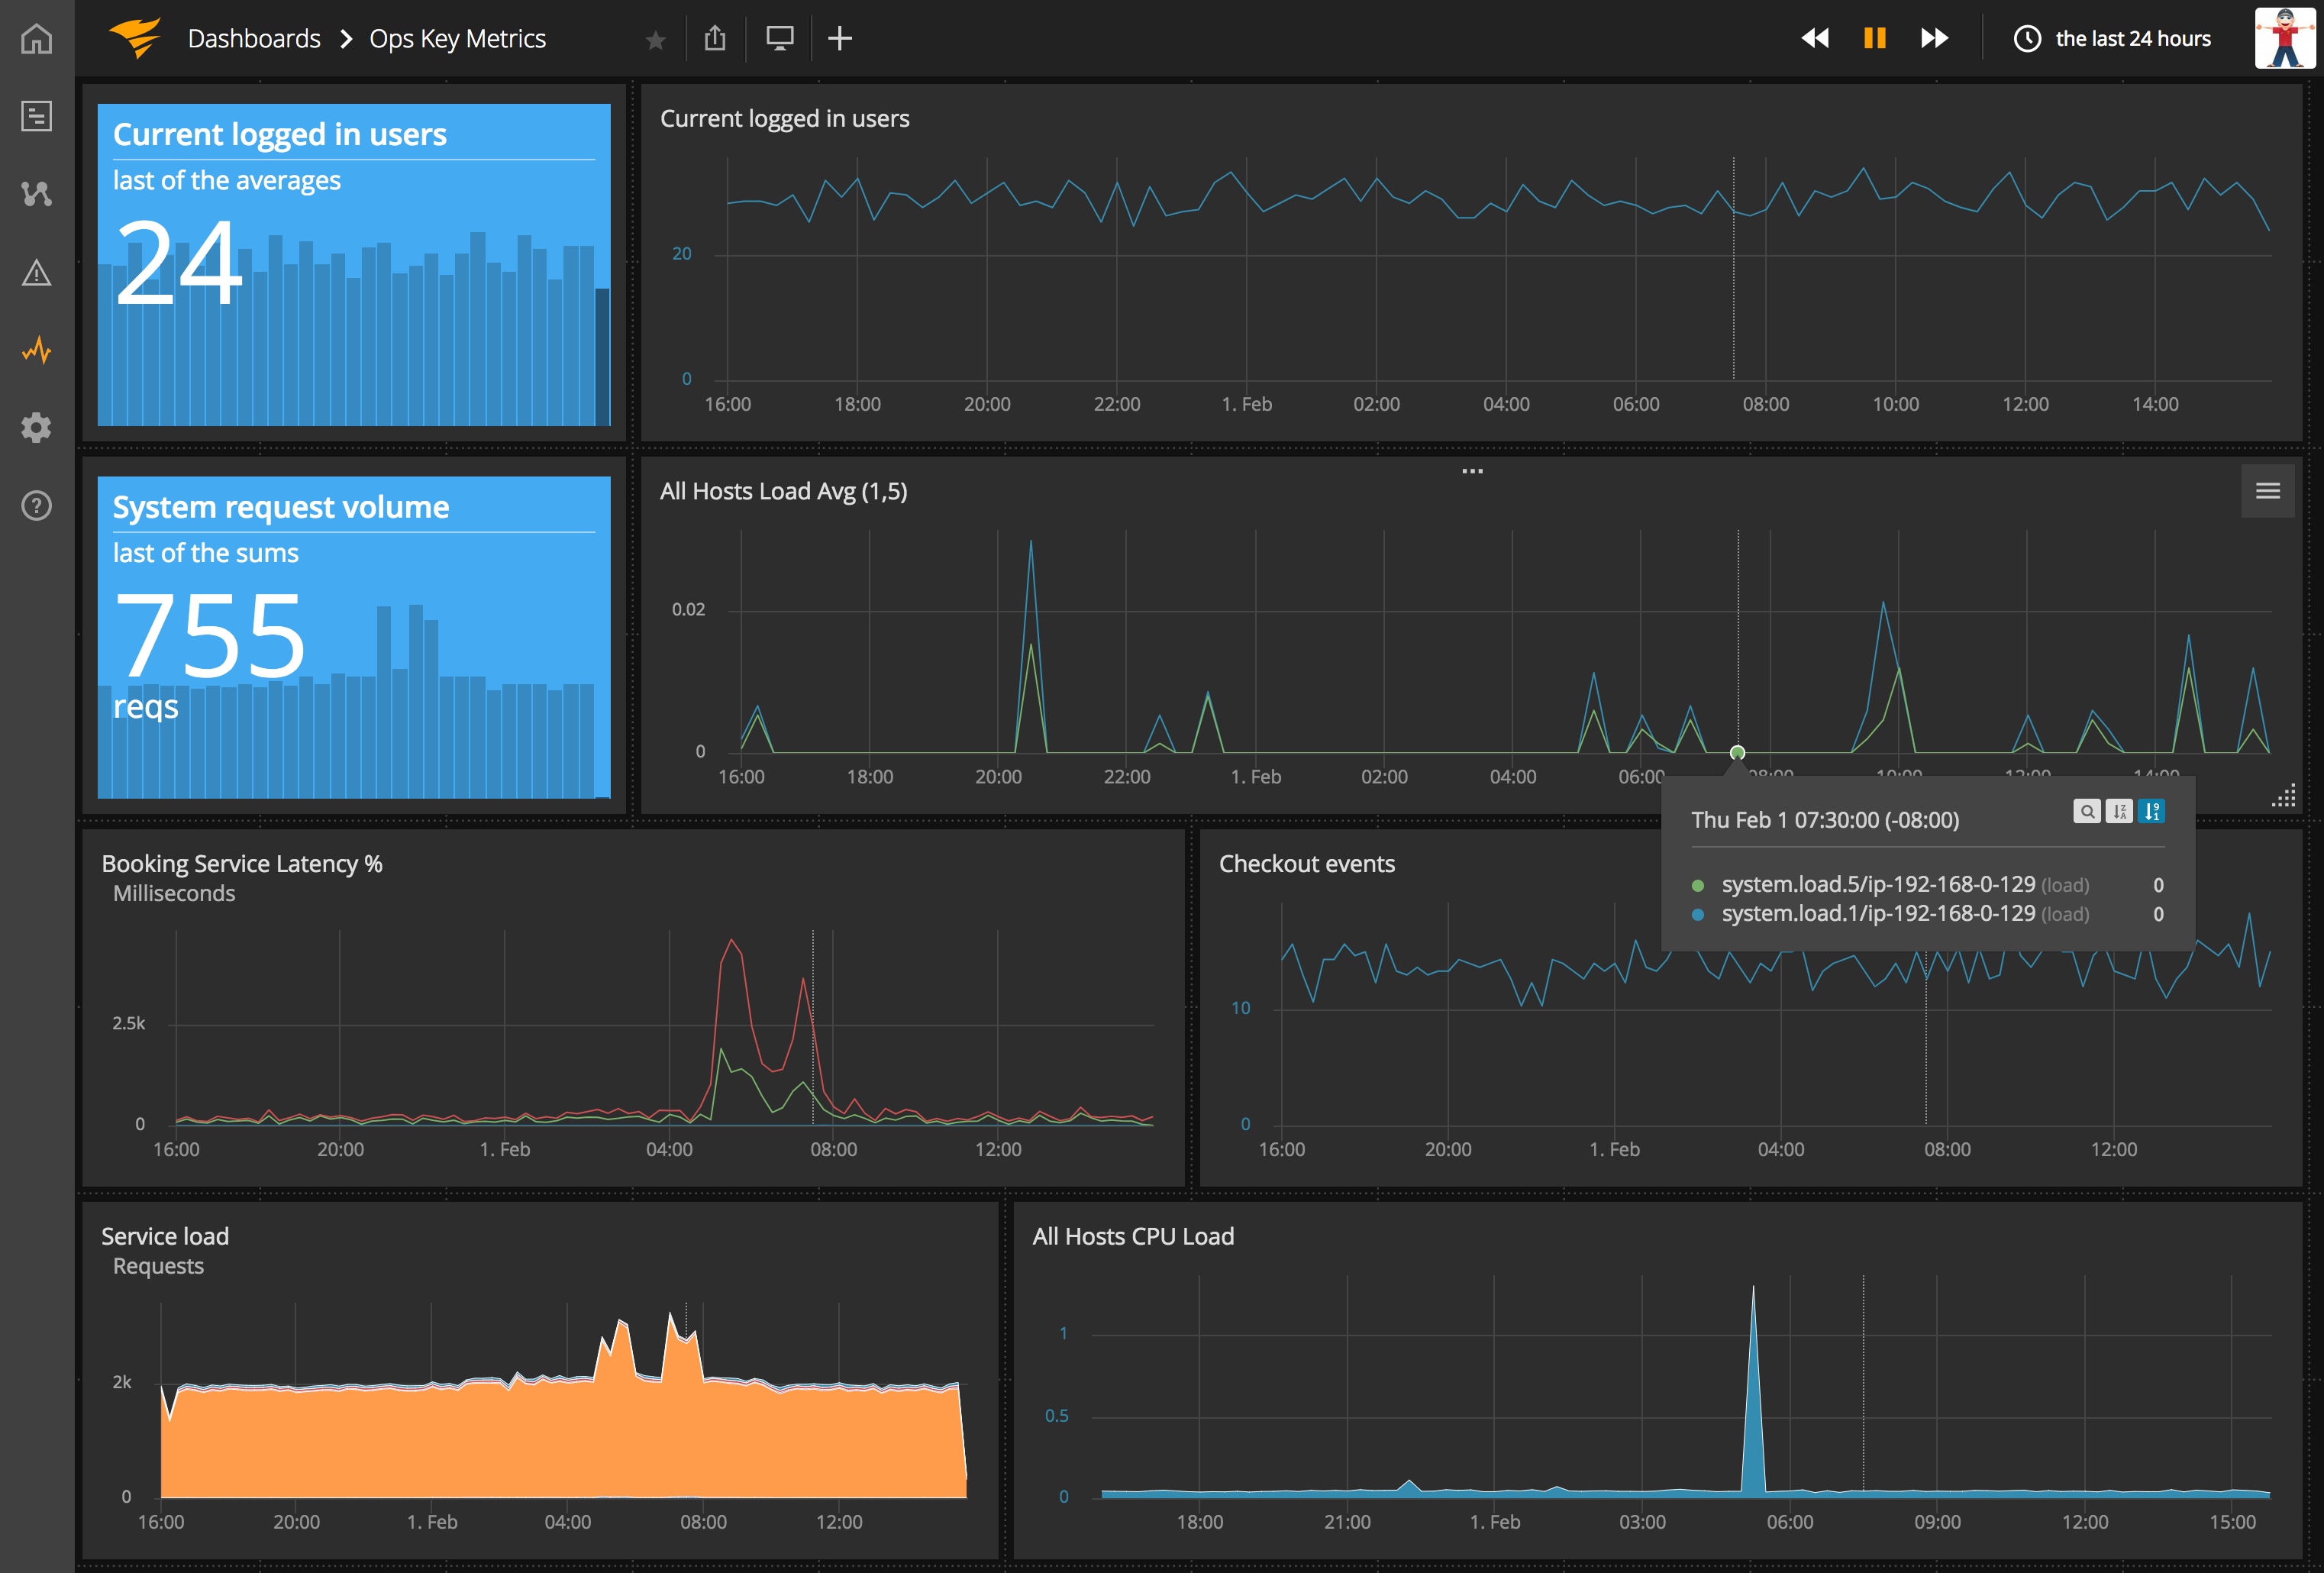
Dashboard Profiles give you the ability to save the position and scale of all the charts on your dashboard, as well as whether the dashboard should be themed dark or light.

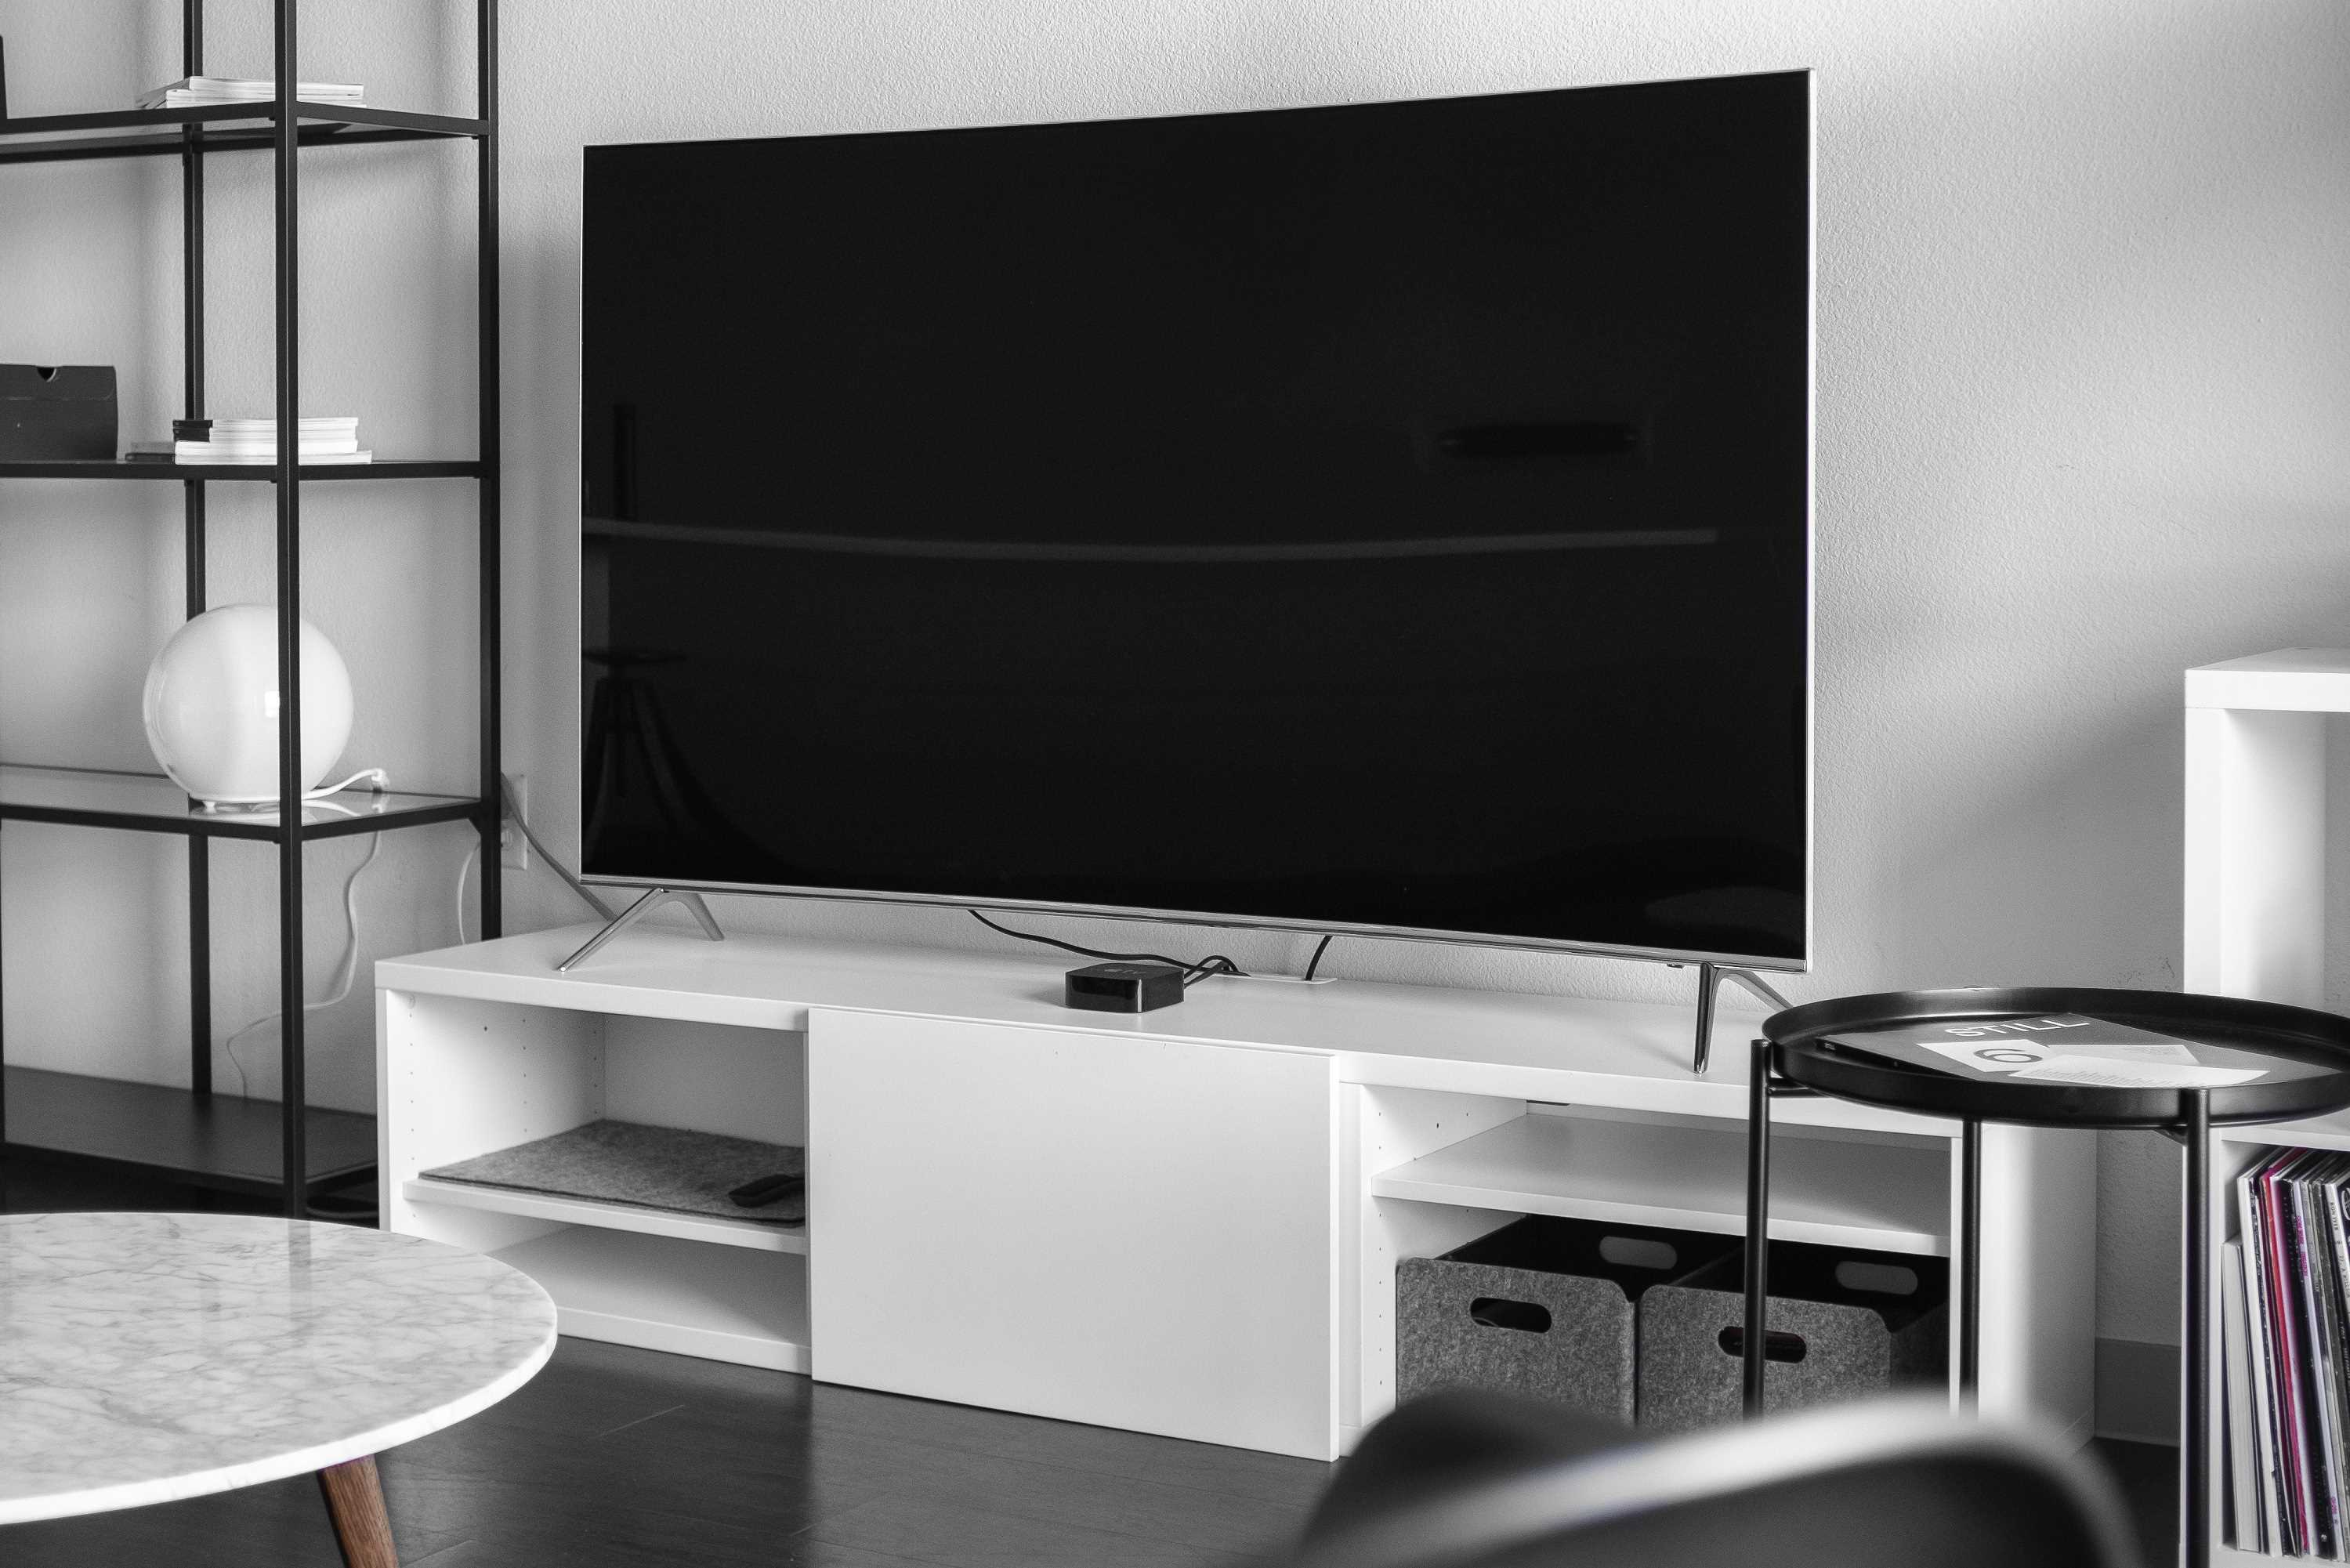
Large wall-mounted displays have a lot more visual real estate than your very convenient and portable 11 inch MacBook Air. They also provide a more passive way to consume your time series data, so it makes sense that the layout and theme of your dashboards on these devices would differ. Using profiles, you can orient your dashboards for the optimal viewing experience per situation/device.

Create as many profiles as you need, easily switch between them, and apply any profile as the default when that dashboard loads. We’ve put together a public dashboard with Dark Theme applied so you can see it in action.

We hope you find this feature as easy on the eyes and helpful as we have. As always, pass along your feedback—good or bad—and follow our changelog for more regular AppOptics updates.

Check out the dark theme for yourself, click here for a 14-day free trial of AppOptics.

The AppOptics and SolarWinds trademarks, service marks, and logos are the exclusive property of SolarWinds Worldwide, LLC or its affiliates. All other trademarks are the property of their respective owners.

Related articles

© 2024 SolarWinds Worldwide, LLC. All rights reserved.