A lot happened last quarter, so you might have missed a few of the shiny new features now included with SolarWinds® AppOptics™. Don’t worry, we rounded up the recent updates here so you can get the most out of your application performance monitoring (APM) with AppOptics.

Simplified Application Root Cause and Service- and Trace-Level Root Cause Summary Views
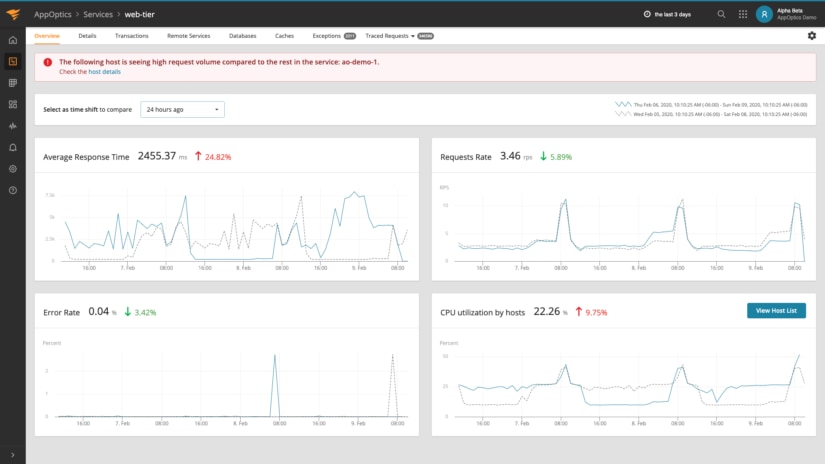
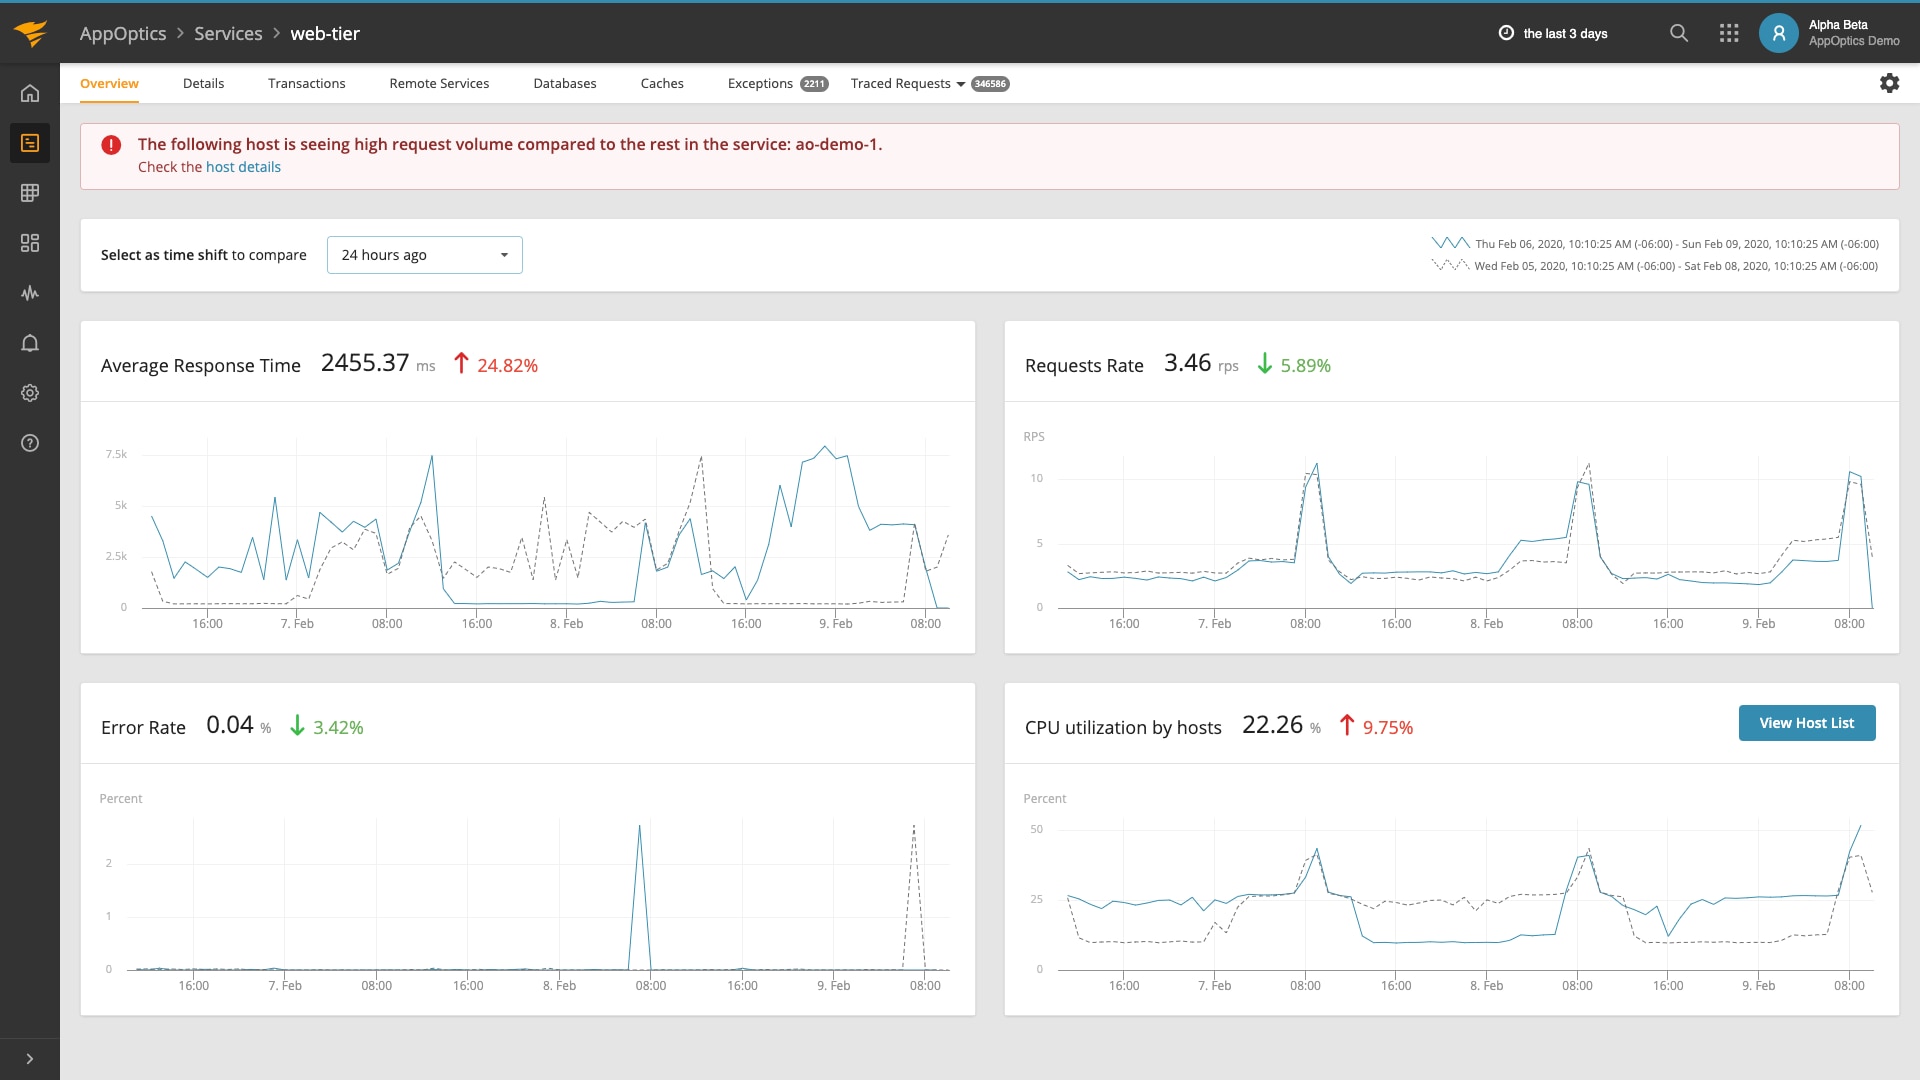
The new service- and trace-level views expand the types of IT professionals who can use AppOptics.
- We’ve provided a simplified, summary view to our service and trace detail pages
- The summary views identify the probable issue with an application service and trace
- Making it easier for a developer, SRE, even IT operations to pinpoint the root cause of a performance issue
SOC2 Type 1
AppOptics has passed an independent SOC 2 Type 1 audit. This audit involved investigating criteria such as availability, confidentiality, processing integrity, privacy, and security of customer data.
For more information on how we’ve implemented security standards to protect customer data now and into the future, please go to our new security page.

Application Service Map
Drill into metrics and understand relationships and dependencies with this powerful visualization.
The application service map shows:
- The relationship between services
- Service dependencies
- Database
- Users can find links to the database tab for each service calling the database
- Cache
- Users can find links to the cache tab for each service calling the cache
- External Domain
- Users can find links to the remote call tab for each service calling the external domain
- Metric drill down by service, including latency
- average latency
- requests per minute
- error rate
- CPU usage
- Database
SAML Support
SAML v2.0 makes it easier for you to access your AppMan APM products.
With SAML enabled, you can log in to your Active Directory® domain or IdP and have immediate access to the SolarWinds APM portfolio (AppOptics, Loggly®, and Pingdom®), with no additional login required.
What is SAML – Security Assertion Markup Language (SAML) is an industry-standard single sign-on (SSO) format.
- It’s widely used in many enterprise systems and applications. Once enabled, it allows you to automatically authenticate into an application without typing an additional username or password.
- More and more organizations, especially larger enterprises, rely on robust federated identify providers, such as Active Directory, to authenticate users and enforce user identity verification policies.
Snap Agent V3
With the release of Snap 3.0.0, the approach to configuring integrations have changed, and it’s now focused on working with “service tasks”—allowing configuration, selection of metrics, and tagging in one place.
It also allows you to easily and clearly combine metric sources for your service in one file.
Snap Agent V3 Features
- Snap dynamic metrics are now clear to read and understand, as all the dynamic fields are clearly named, but also various ways of filtering is provided
- The Snap Agent V3 is backward compatible, so you don’t need to change your existing configuration
- To make life easier, if you need i.e., to monitor many databases and the configuration is different (i.e., only by connection string), you can easily simplify your configuration by using plugin configuration templates
- Snap 3.0.0 also brings new enhanced v3 REST API, providing you with detailed information on running tasks, plugins they use, and how to manage all of them
Runtime Metrics
Go runtime metrics are gathered from the standard library’s runtime package and reported by the agent on interval.
Node.js Runtime Metrics
Node.js runtime metrics are gathered and reported by the node agent transparently to the application.
The metrics cover the interval being reported, e.g., the CPU usage reported covers the interval, not the entire time the application has been running. Time-based metrics are reported in microseconds (millionths of a second).
Tracing Non-Web Applications
AppOptics provides auto-instrumentation for both MQ and back-end applications in addition to the existing auto-instrumentation of web applications.
By adding this feature, non-web transactions instrumentation enables correlation between the producer side and the consumer side as a distributed trace.
Curious what’s in store for AppOptics? Join our community on THWACK® and stay up to date on the latest updates from our product team.
If you haven’t experienced the simple-to-install and easy-to-use SolarWinds AppOptics, maybe now is the time. Explore its comprehensive infrastructure server and virtual host—alongside auto-instrumented root cause, detailed service and transaction traces, and insights down to the line of poor performing code. Sign up for a 30-day free trial.


