SolarWinds® AppOptics™ has recently released an automatic collection of Go runtime metrics through the Go APM agent. These runtime metrics enable easy correlation between application performance and runtime information, such as garbage collection, number of calls to a C library, and the overall count of goroutines.

Why should I monitor the Go runtime?
Calls to C Libraries might be causing performance issues
If you call C libraries in your Go code, it can lead to performance issues. According to research, invoking a C library has an overhead of ~171ns/op. If your application relies heavily on C libraries, this overhead can add up to create a slow application even if the actual C and Go code is performant.
It has become routine to create goroutines
A high number of goroutines isn’t usually a concern in a Go program because goroutines are lightweight. However, when a change to the system (e.g., a new deployment, a configuration change) causes a sharp rise in the number of goroutines, this could be a sign of non-performant changes.
Every day is garbage collection day
Tuning the Go runtime parameters is an advanced, but sometimes necessary, topic to address. The first step is to monitor garbage collection and understand if it’s a problem. By viewing latency percentiles right beside garbage collection times, it’s easy to see the correlation between a stop-the-world garbage collection event and the response time of the application. If these stop-the-world events are prevalent and are affecting the service’s performance and even your end-user experience, start tuning your Go runtime.
Your app is a memory hog
Get to know the memory footprint of your program by monitoring the memory metrics. You could track memory allocations and frees, and observe the current active objects of the heap. The memory footprint trend over time is helpful for ops teams to catch memory leaks and right-size the infrastructure behind a new service.
How do I get started?
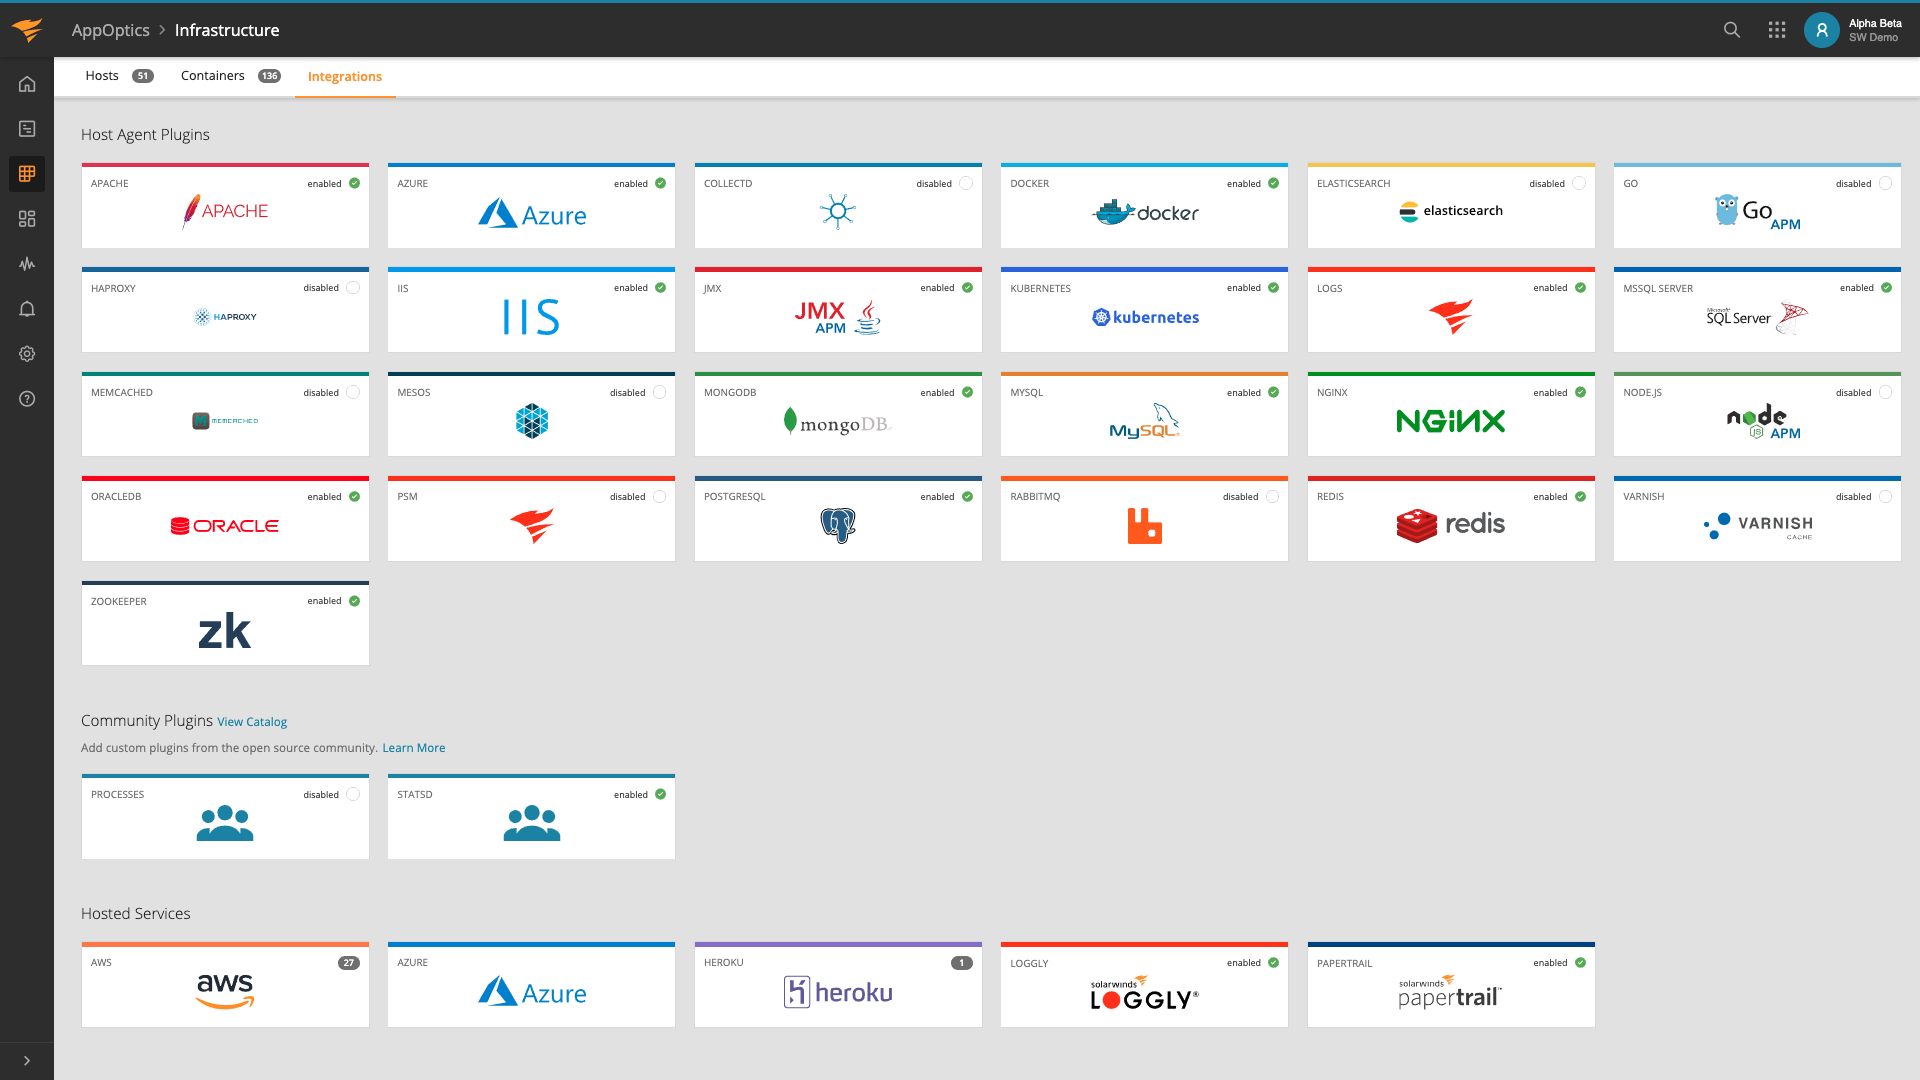
As soon as the AppOptics Go agent is installed, Go runtime metrics start being collected and a new dashboard appears where you can easily monitor them. The application performance monitoring (APM) Go Runtime dashboard can be filtered or grouped by service and host to isolate Go performance issues and see how those issues affect your application latency, throughput, and status codes.
Do I need to make any changes to take advantage of this feature?
If you’re already running the Go agent, these metrics are now available in your account. If you haven’t installed it yet, you can do so to take advantage of Go metrics and detailed APM and distributed tracing.
Summary
With Go runtime metrics reported by the Go APM agent, you get insight into how your program is running. This is critical to the system health monitoring and allows further performance tuning.
If you haven’t experienced the simple to install, easy to use, AppOptics APM, maybe now is the time. Explore its comprehensive infrastructure server, virtual host, and combined with the auto-instrumented root cause, detailed service and transaction traces, and insights down to the line of poor performing code. Signup for a 30-day free trial.
