Note: This article was originally published on Librato, which has since been merged with SolarWinds® AppOptics™. Learn more about monitoring Apache performance using AppOptics.
Having recently celebrated its 20th birthday in 2015, Apache has a long and impressive record of dominating the web server space on the Internet. In a survey conducted in July of 2016 by Netcraft, Apache was reported to be the most popular server with 46.4% of market share. (https://news.netcraft.com/archives/2016/07/19/july-2016-web-server-survey.html)
If you’re reading this article, I suspect you’re an Apache user, and that you’re well acquainted with its stable nature, and modular architecture allowing it to be configured to meet a multitude of needs. As stable as Apache is, it is nevertheless important that users implement a robust monitoring system to ensure that the web server functions efficiently, and that potential problems are identified before they lead to fatal events.
In this article, we’re going to look at the importance of monitoring, and identify the key metrics and indicators that should be included in a monitoring plan. With an understanding of what we should be monitoring, we’ll look at integrating Apache and Librato to surface those metrics in a meaningful way. We’ll finish by building a custom dashboard and discuss additional steps you should consider.
Coming Up with a Monitoring Plan
The purpose of a web server is to accept requests from clients and respond with appropriate content. Content can take the form of static web pages, dynamic web pages, or other media. As administrators, or operations staff supporting a web server, we should be concerned with the following aspects of the server related to that purpose.
- Requests received
- Appropriate response codes are generated
- Requested content is returned
- Latency is minimized
- Any errors and exceptions are appropriately handled
In observing and actively monitoring each of these areas, we want to ensure that we collect relevant and timely metrics and analyze them, so as to ensure a smooth and efficient user experience. Additionally, we also want to monitor trends to identify cases where that experience might be trending towards an undesirable state.
9 Key Metrics to Consider
Let’s look at specific metrics and thresholds we’ll want to monitor directly from the Apache installation, and the underlying infrastructure.
Apache Web Server Metrics
1. Requests per second
- This metric is specifically used to measure the server performance. Used in combination with other metrics, it can be used to determine how the server performs under different loads. Additionally, significant changes in this number can point to other problems, such as a failure of infrastructure between the server and its clients, shown by a drastic drop, or a surge in requests, which might point to an attempt at a denial of service (DOS) attack.
2. Bytes per second
- This metric measures the amount of information being transferred in and out of the server. This metric can be used as an indicator of server performance, relative to constraints such as network infrastructure.
3. Bytes per request
- This metric indicates the amount of information that is transferred with each request.
4. Uptime
- Uptime is usually measured in seconds, since the server was started. Unexpected drops in uptime can indicate unplanned outages or restarts of the server.
Infrastructure-Specific Metrics
5. CPU Usage
- An indication of the processing usage of the underlying machine. This should be measured as utilization across all cores if using a multi-core machine.
6. Memory Usage
- Measurement of the memory currently in use on the machine.
- Similar to traffic, this is a measurement of information flowing in and out of the machine.
8. Disk usage
- Even if the web server is not physically storing files on the host machine, space is required for logging, temporary files, and other supporting files.
9. Load
- The load metric is a performance measurement which combines many of the other metrics into a single number. Ideally, the “load” on the machine should be less than the number of processing cores.
Monitoring Tools
One way to monitor an Apache installation is by leveraging the mod_status plug. In addition to collecting data, we’ll also need a place to gather it, analyze it, and provide meaningful information which we can act upon. For this purpose, we’ll make use of Librato. Librato provides easy integration with a number of applications, including Apache and its predefined dashboards, meaning that you can start collecting data from your web server within minutes.
Let’s look at how to configure each of these parts to view system information on the dashboard provided by Librato, and then take it one step further by customizing the dashboard to better fit our needs.
Before we begin, you’ll need an account set up with Librato.
Installing the Monitoring Components
The first thing you will want to do in order to allow Librato to aggregate the metrics from the server is to install the Librato agent on all machines which host an Apache server. In order to do this, you’ll need to reference your Librato API key. Log into your Librato account and navigate to the Integrations page.
![]()

Locate the Librato Agent integration, and click on it. It should look similar to the image below.

I used the Easy Install option when setting up the instances for this article. Ensure that Easy Install is selected, and select your Linux distribution. I used an Ubuntu image in the AWS Cloud, but this will work on almost any Linux server.
Note: Prior to installation of the agent, the second box on the screen below will not contain the success message.
Copy the command from the first box, and then SSH into the server and run the Easy Install script.
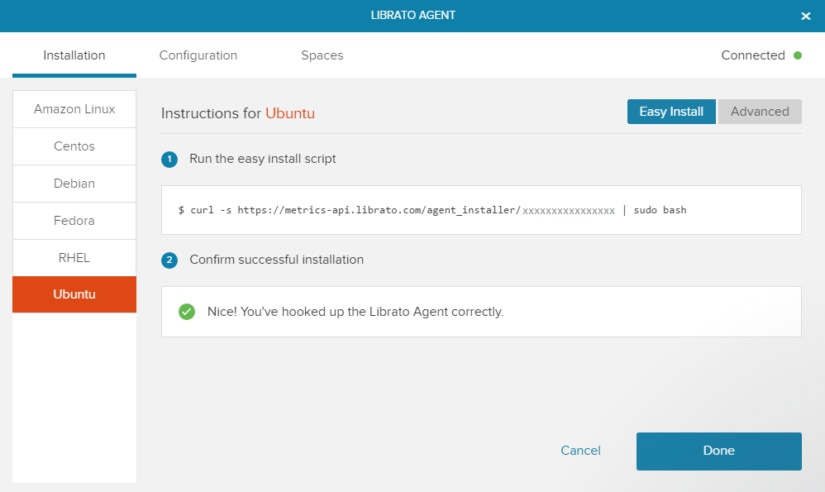
If the agent installs successfully, you should be presented with the following message on your terminal. The “Confirm successful installation” box on the Librato agent screen should look similar to the above, with a green checkbox. You should also see “Nice! You’ve hooked up the Librato Agent correctly.”

Configuring the Monitoring Components
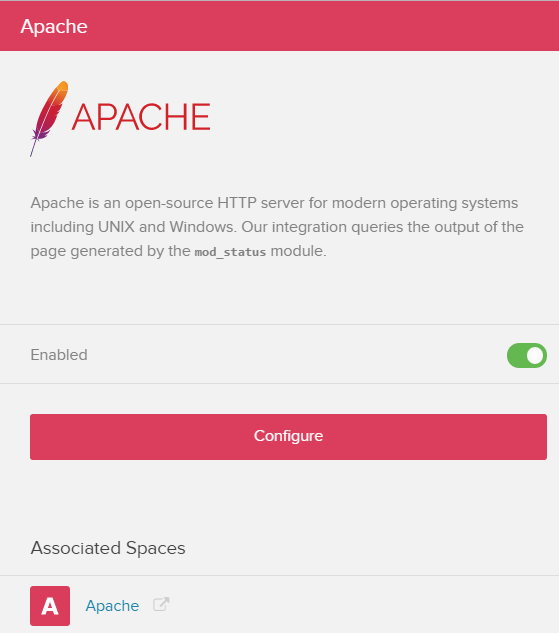
With the Librato agent installed on the server, there are still a couple of configuration changes which need to be made in order to connect the web server with Librato. Navigate back to the Integrations page and locate the Apache integration.

Click on the integration, and the panel shown below will appear. Enable the integration, and then click on the Configuration button. A second panel will appear with specific configurations to be made to the instance. Some familiarity with Apache and its configuration will be required at this point. As mentioned previously, the mod_status module for Apache will need to be enabled. The integration also makes use of the collectd utility to gather and transfer metrics. In order to facilitate this, the Apache plugin for collectd will need to be enabled. Both steps are described on the configuration page.
Once these changes have been made, you’ll need to restart the collectd service for the changes to take effect, and your metrics will start flowing from the server into Librato.
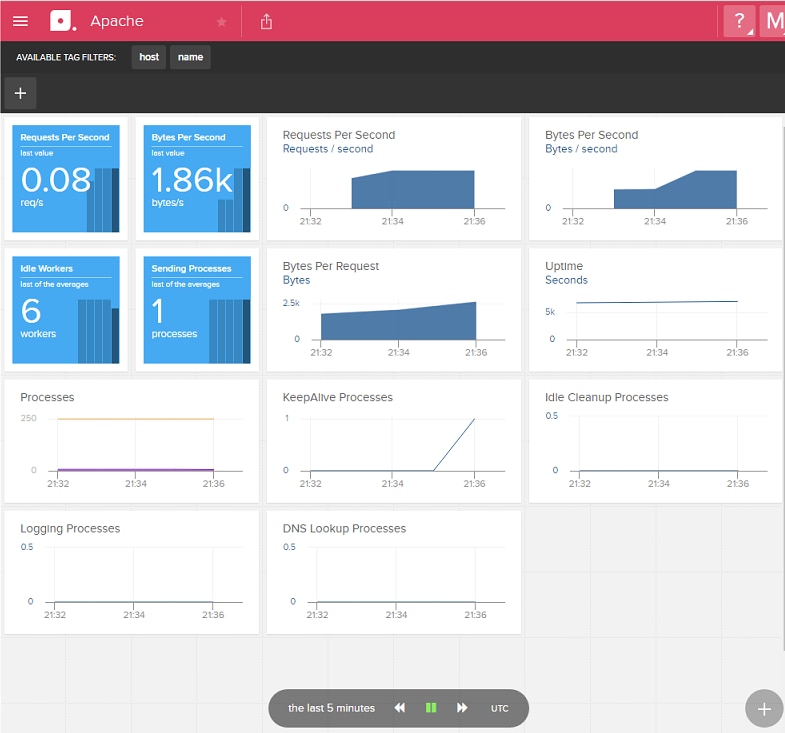
When everything is configured, either click on the Apache icon under Associated Spaces, or navigate to the Spaces page directly, and then select the Apache icon to view the default dashboard provided by Librato.
![]()

Working with the Apache Space
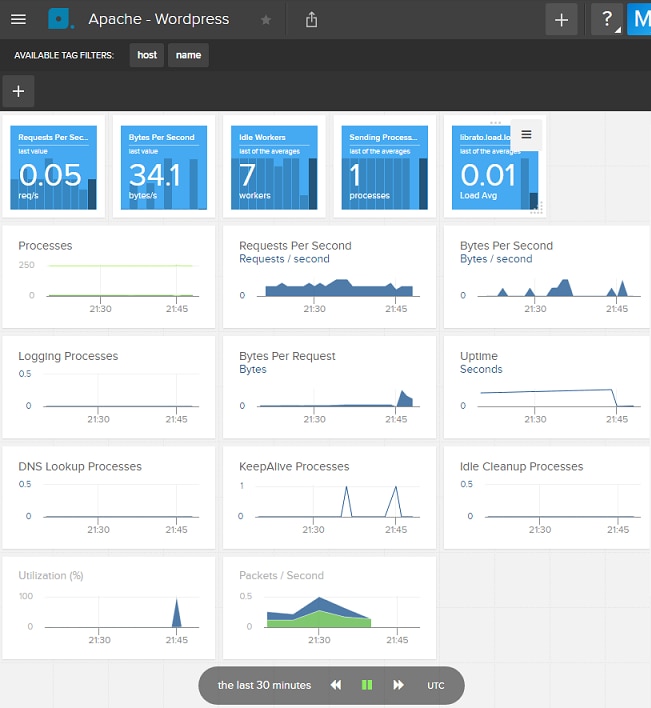
The default Apache space provided by Librato offers many of the metrics listed above, related to the performance of the web server, and should look similar to the image below.
One thing that I noticed was missing from the dashboard was information about the underlying infrastructure. Unfortunately, you can’t make changes to the default space, but it’s really easy to create a copy, and then add additional metrics of your own. Start by clicking the Copy Space button at the top of the screen to create a copy.
![]()

Create a name for your custom space. For this example, I’m monitoring a simple WordPress website hosted on the LAMP stack, so I’m going to call mine “Apache – WordPress.” Make sure to select the “Open Space on Completion” option, so you can start editing your new space as soon as it is created.
Alright, let’s do some customization. First, we want to ensure that we’re only monitoring the instances we need to. We do this by filtering the chart or space, and you can find out more about how to set and filter these in the documentation for Dynamic Tags.
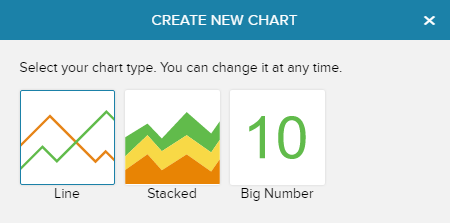
Let’s look at CPU usage, network traffic, and load. Look at the bottom right of the space, and click on the Plus button. For CPU and memory usage, let’s add a Stacked chart. We’ll add one for each. Click on the Stacked icon.
In the Metrics search box, type “CPU” and hit enter. A selection of available metrics will appear. I’m going to select AWS.EC2.CPUUtilization and librato.cpu.percent.system, but your selection may be different depending on the infrastructure you’re using. Select the checkbox next to the appropriate metric, and then click on Add Metrics to Chart. You can add multiple metrics to the chart by repeating the same process, but we’ll stick with these two for now.
If you click on Chart Attributes, you can change the scale of the chart, adjust the Y-axis label, and even link it to another space if you want to show more detail for a specific metric. When you’re done, click on the green Save button, and you’ll be returned to your space, with the new chart now added. Repeat this for network traffic. The metrics I’m going to use are AWS.EC2.NetworkIn and AWS.EC2.NetworkOut.
For load, I’m going to use a Big Number Chart Type, and select the librato.load.load.midterm metric. When you’re done, your chart should look similar to what is shown below.
Pro tips
- You can move a chart around by hovering over the chart, clicking on the three dots which appear at the top of the chart, and dragging it around. Clicking on the menu icon on the top right of the chart will allow you to edit, delete, and choose other options related to the chart.
- To return to the dashboard after editing or adding a chart, click on the blue icon at the top left of the screen.
Beyond Monitoring
Once you have an application monitoring plan in place and functioning, the next step is to determine baseline metrics for your application and then set up alerts, which will be triggered when significant deviations occur. One such baseline which is useful to monitor is traffic. A sudden increase in network traffic can mean that you’re finally getting that surge of new customers you’ve been dreaming about—or it could mean that your server is the target of a cyber attack. In either case, you’ll want to know so you can investigate and respond accordingly.
To learn more about alerts, visit the Librato knowledge base, and view the documentation on alerts.